Registration Open
Registration Open
31 January | 17:00
-
Reset your password
We'll email you instructions on how to reset your password
Analyze South American demographic and urbanization trends to support effective urban planning and sustainable growth
Workshop | Smart Techniques for Urbanization Data Analysis in Power BI
Workshop | Smart Techniques for Urbanization Data Analysis in Power BI
13 February | 08:00
-
Webinar | Urbanization & Demographics Analysis: Top 5 Power BI Reports & Winner Reveal
Webinar | Urbanization & Demographics Analysis: Top 5 Power BI Reports & Winner Reveal
27 February | 09:00
31 January - 21 February
ZoomCharts Mini Challenge is part of the global DataDNA – Dataset Challenge by Onyx Data, which unites 25K+ data enthusiasts worldwide, ranging from beginners to seasoned professionals, including Microsoft MVPs. Read more about the DataDNA challenge on the Onyx Data website. Join the community on LinkedIn
The ZoomCharts Mini Challenge provides a platform for a growing community to learn how to build PRO reports, aiding business users to explore data quickly and intuitively.
The best report’s creator will receive a $300 Amazon gift card from ZoomCharts. The Top 5 submissions and the winner will be announced on February 27th.
1. Register for the challenge:
2. Build your report in Power BI:
3. Improve your report and learn new skills:
4. Submit your challenge entry:
5. Finalize your participation to compete for the prize:
6. Attend challenge closing webinar to hear the results:
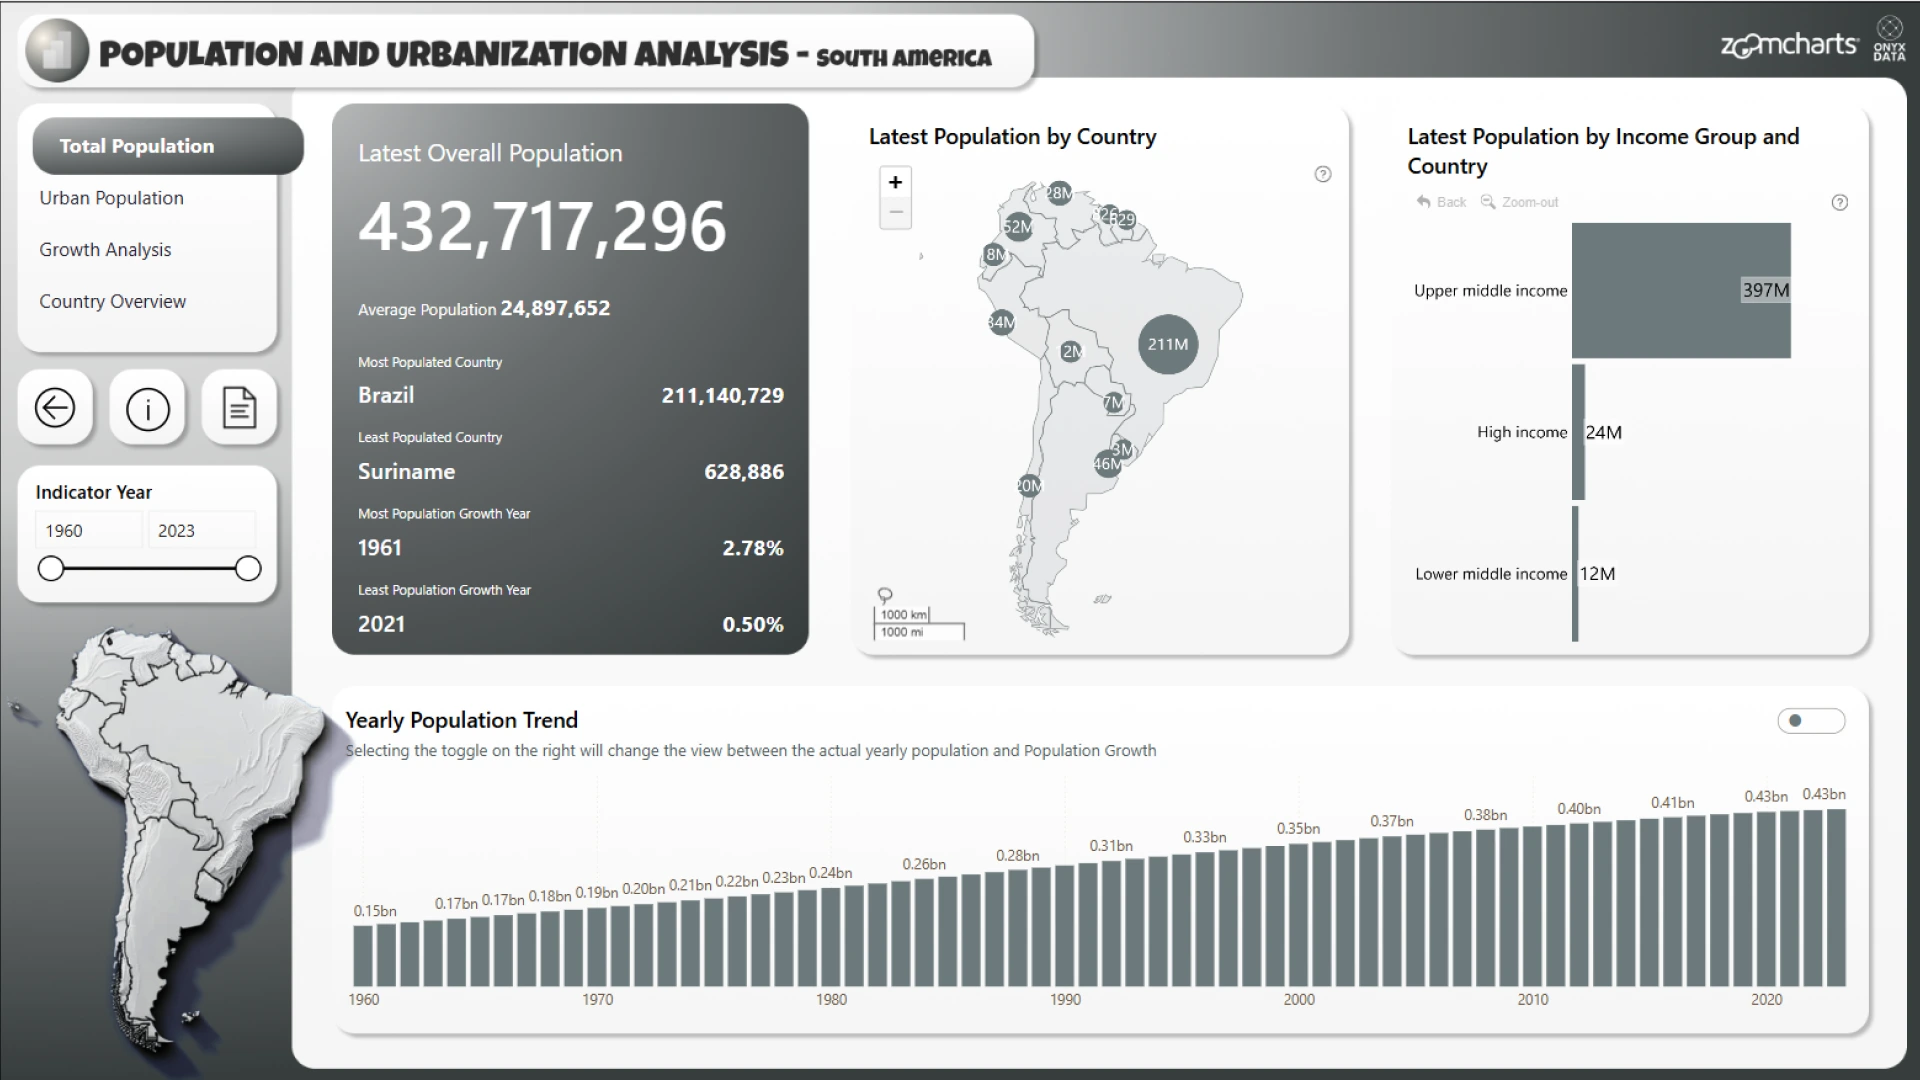
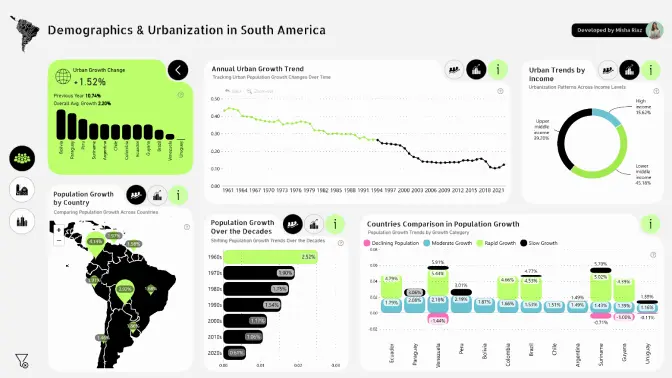
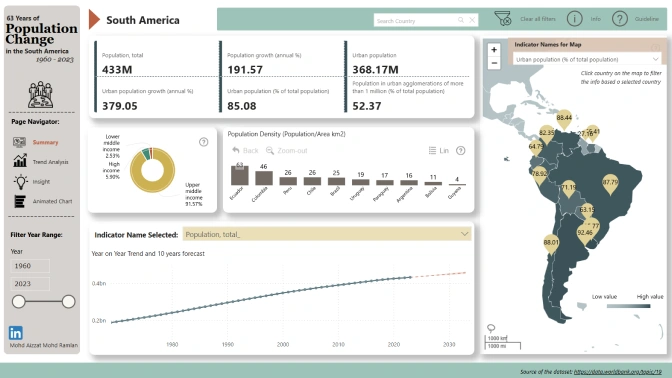
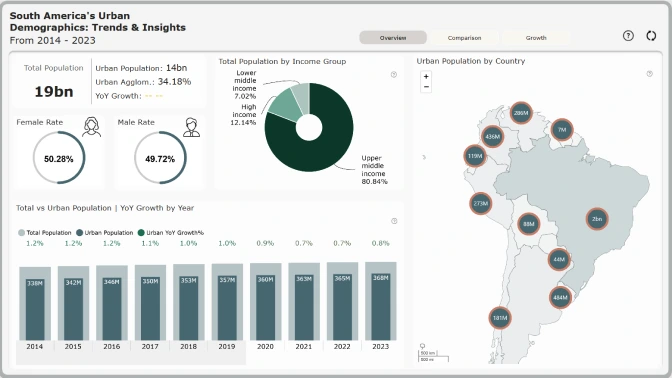
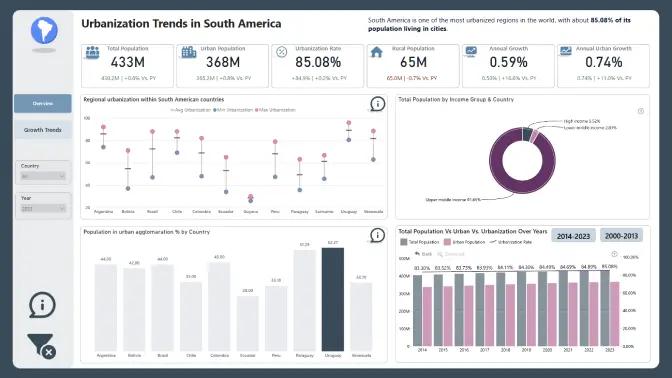
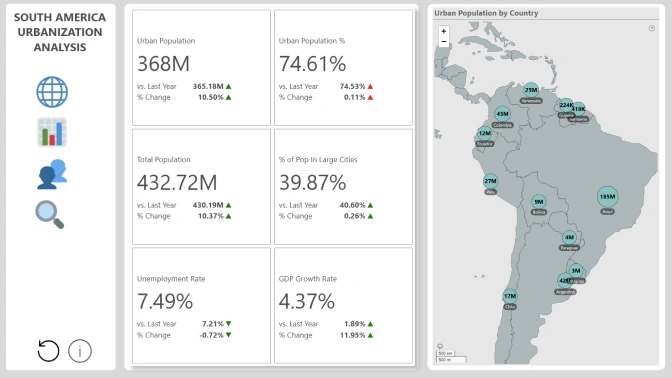
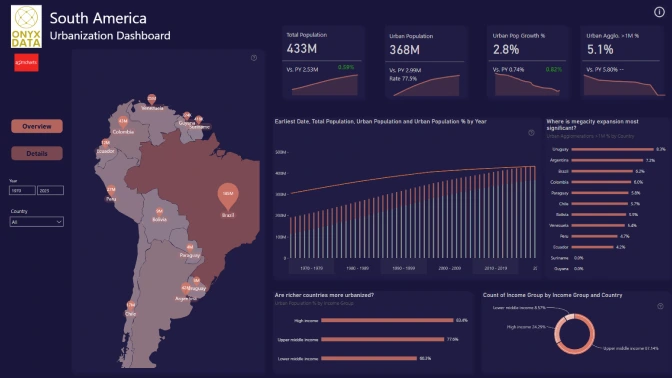
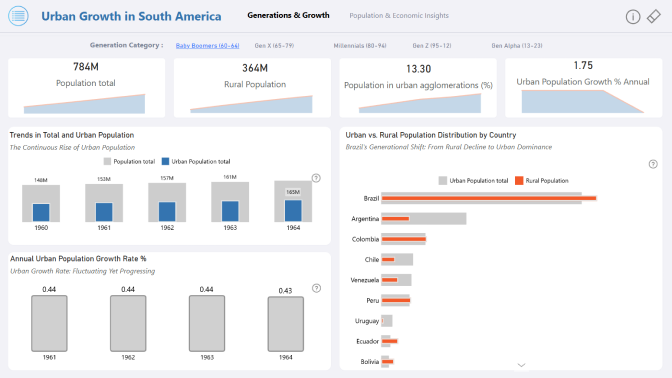
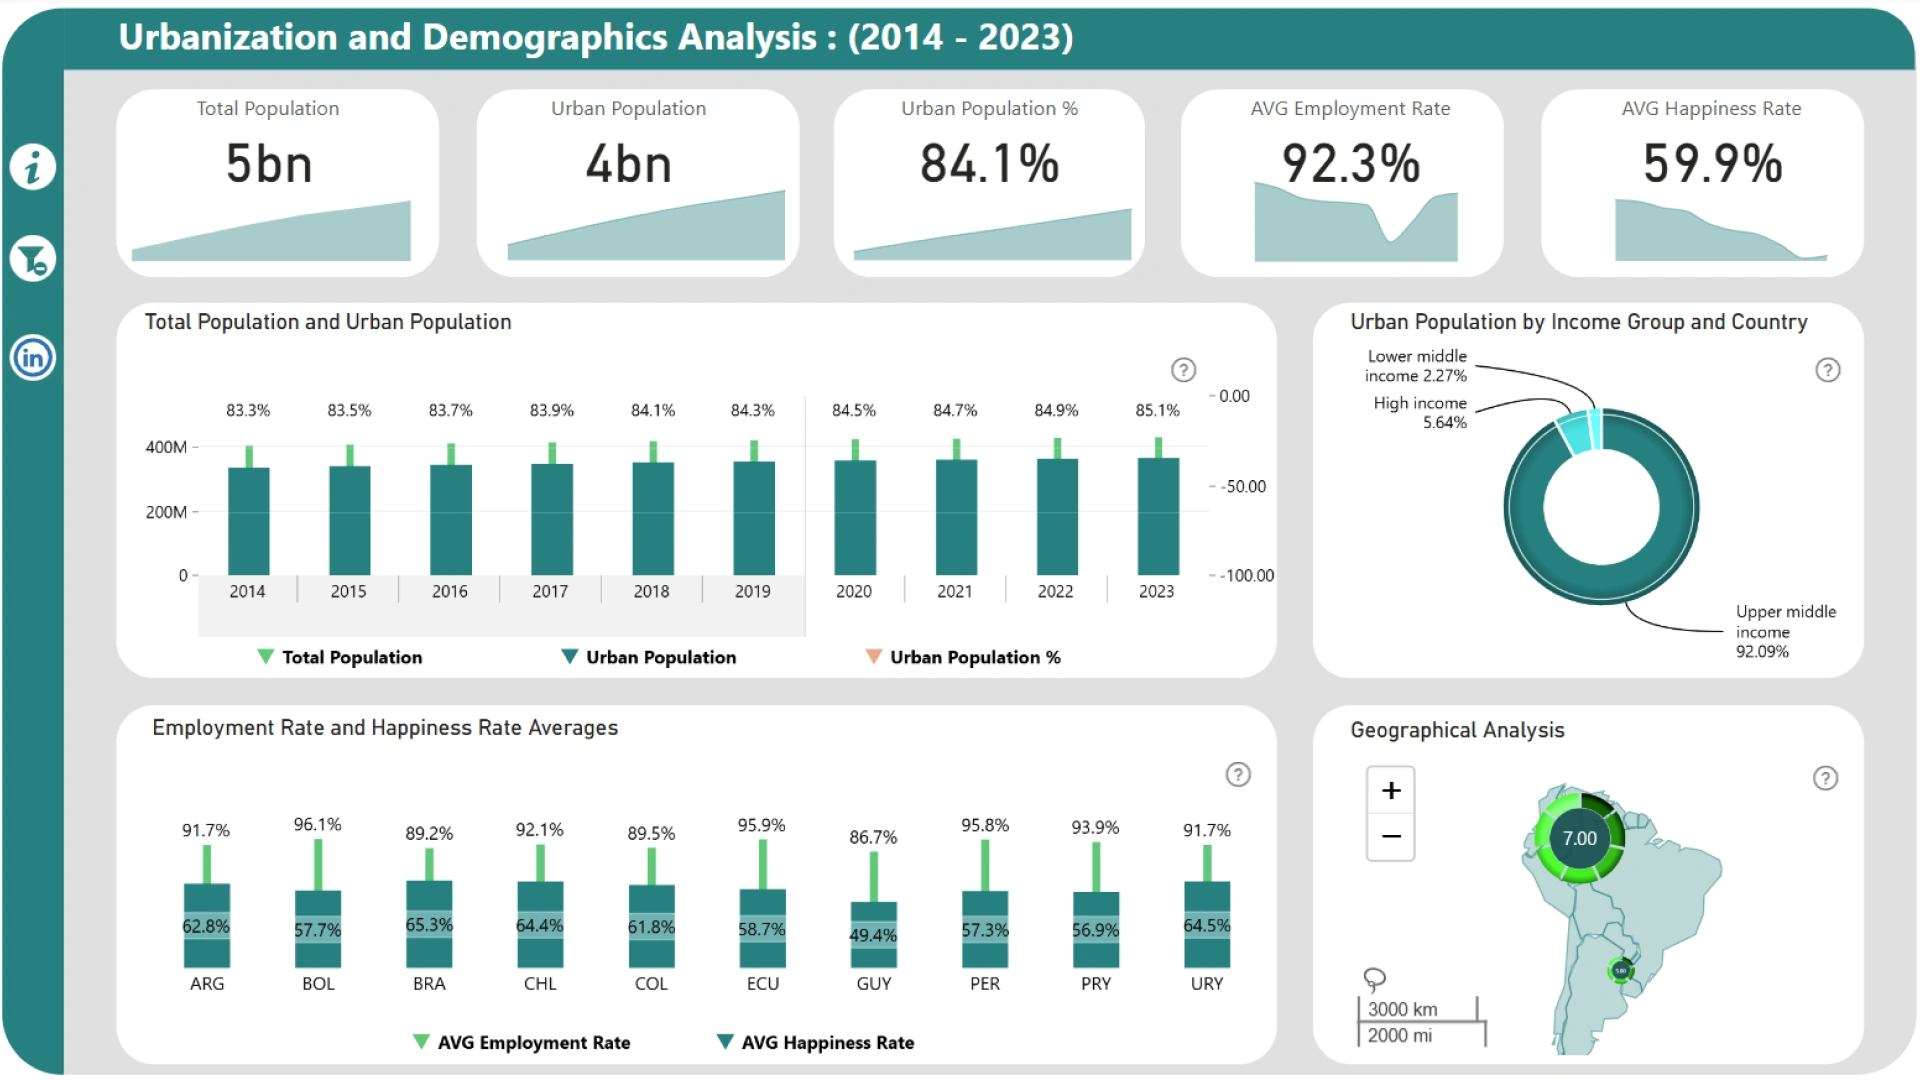
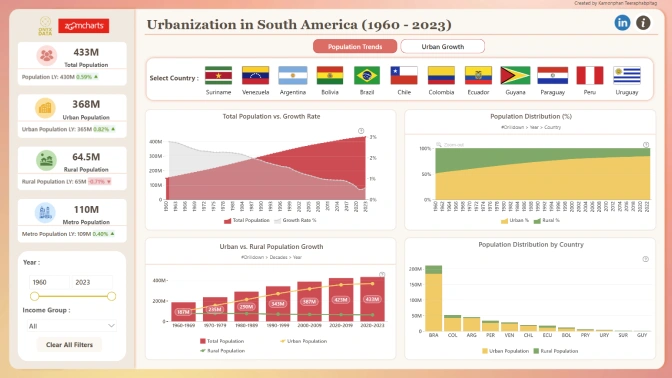
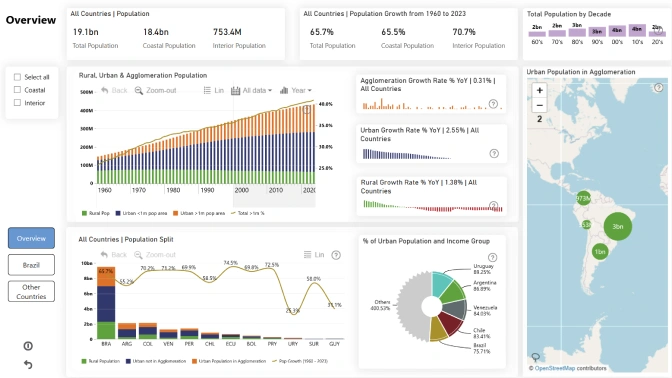
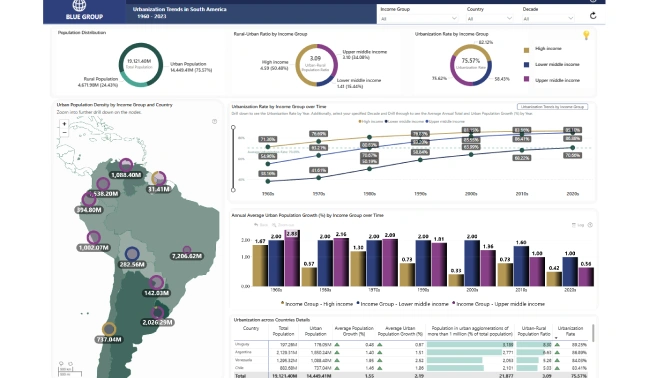
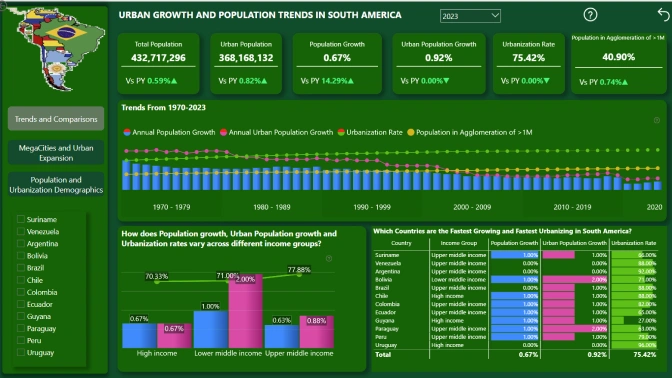
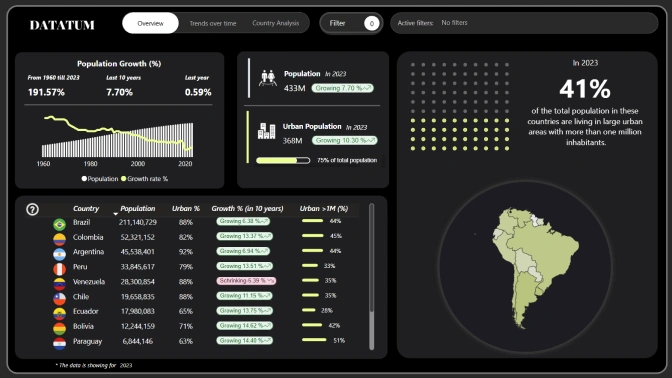
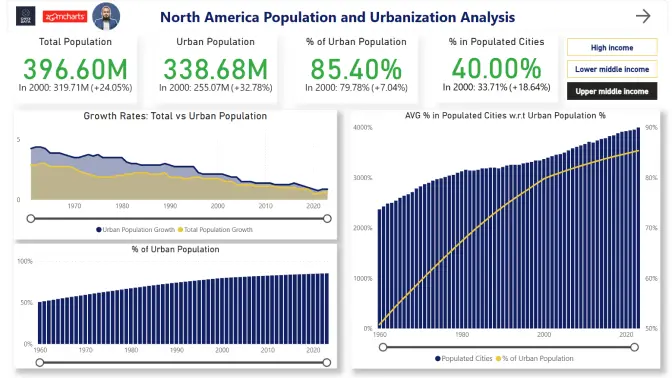
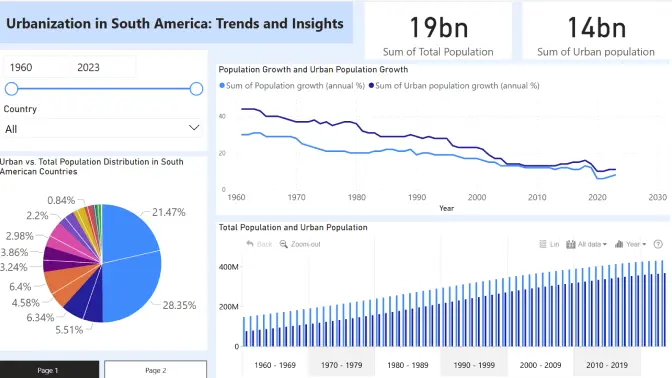
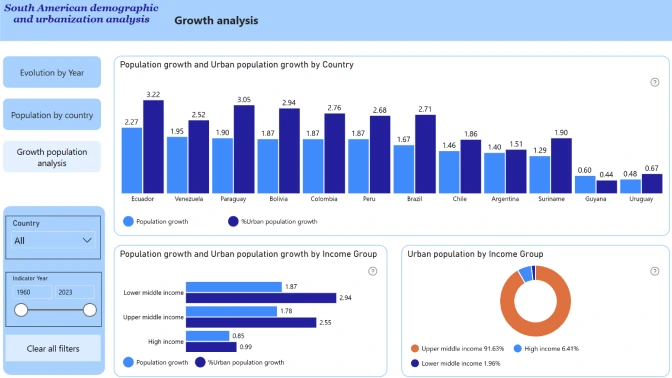
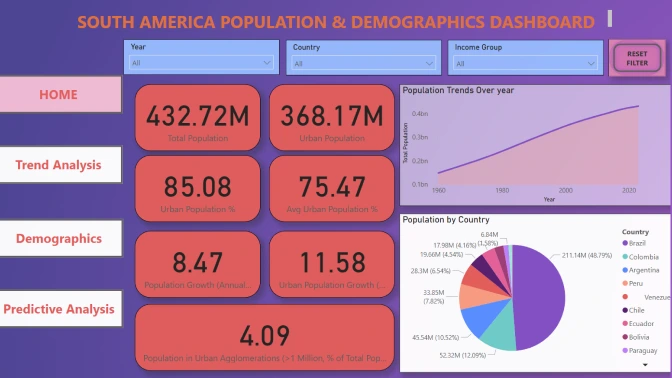
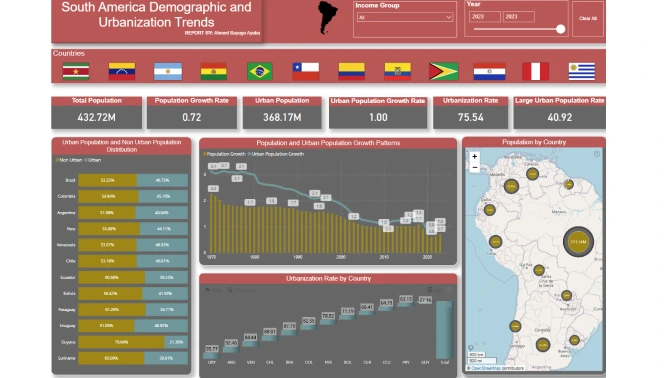
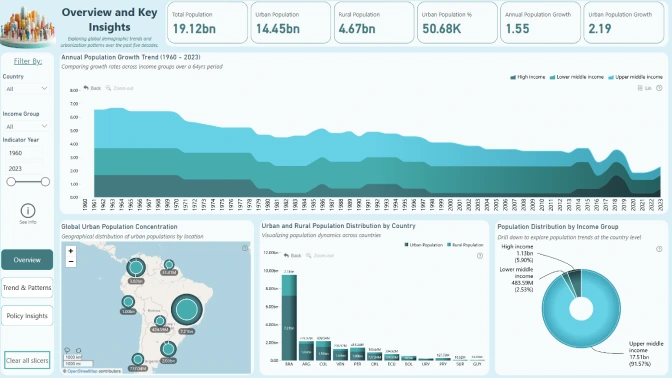
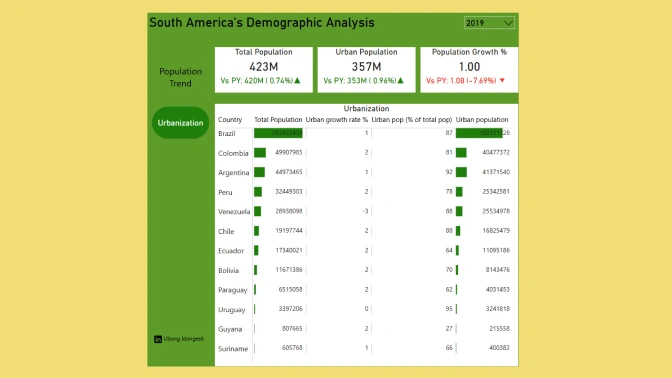
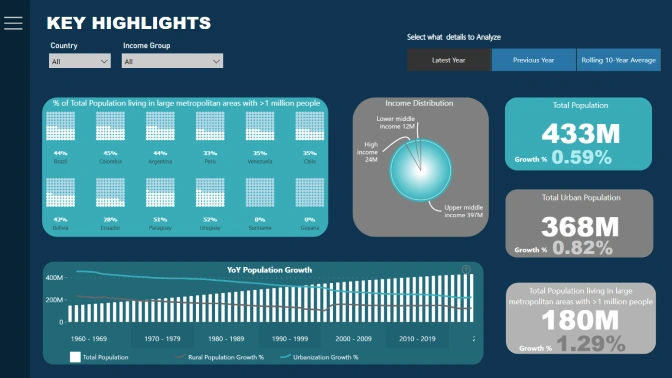
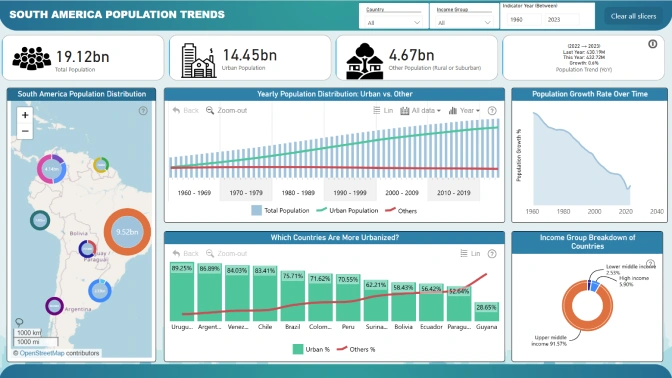
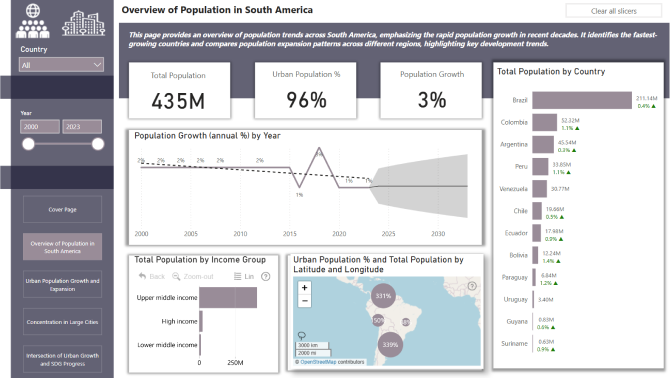
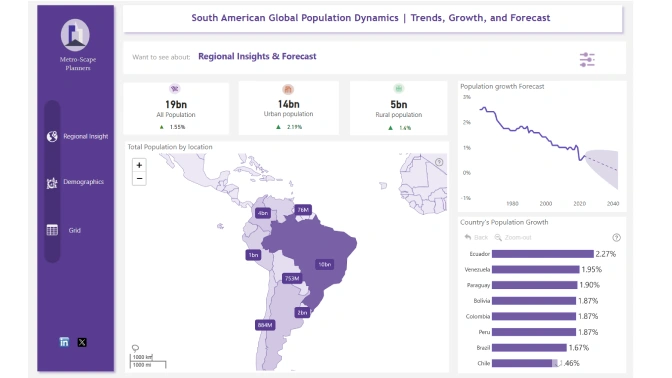
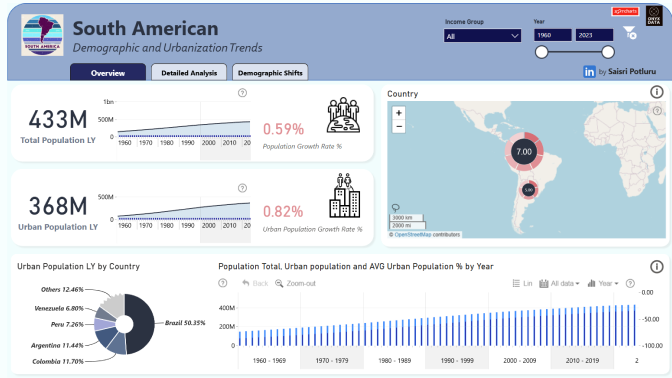
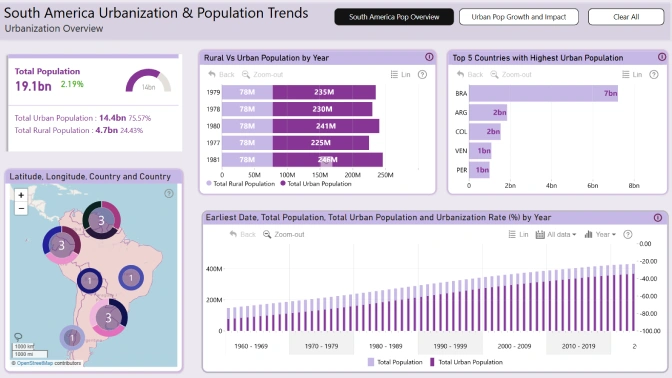
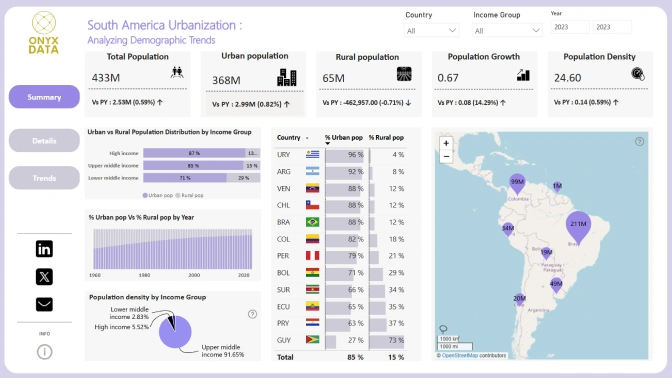
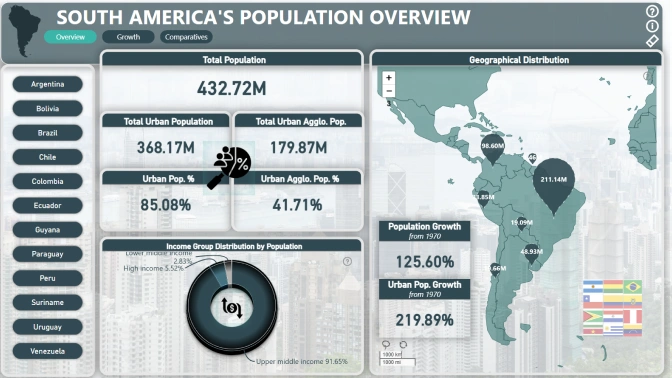
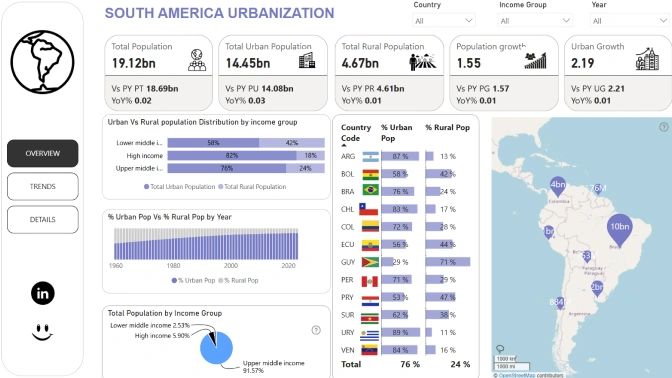
Understanding Urbanization in South America: Key Insights from Population Data
South America is one of the most urbanized regions in the world, with about 80% of its population living in cities. This rapid urban growth brings both challenges and opportunities. On one hand, cities must deal with issues like overcrowding, inequality, and environmental stress. On the other, urbanization can drive economic growth, innovation, and sustainable development.
This data challenge focuses on historical and current population trends to uncover urbanization patterns and demographic shifts. The goal is to identify insights that can help improve urban planning, promote sustainable growth, and build resilient cities.
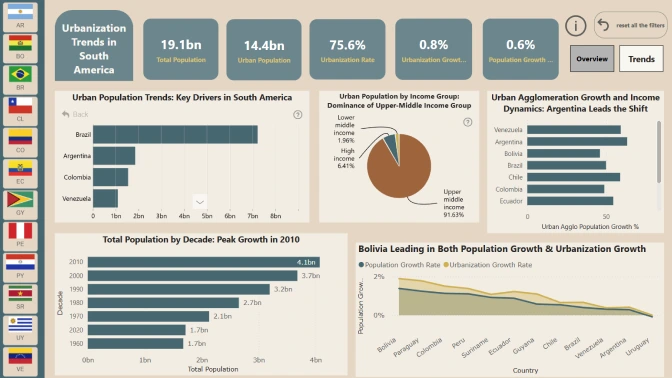
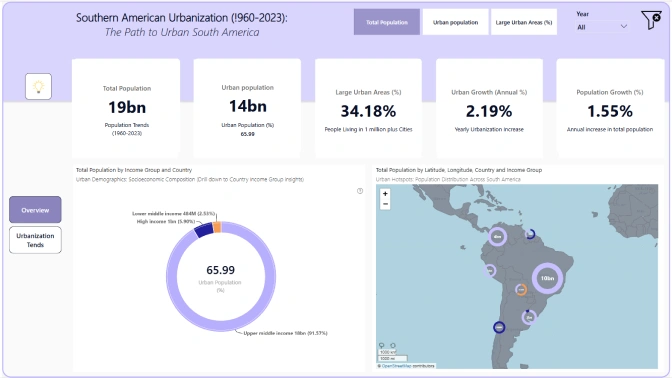
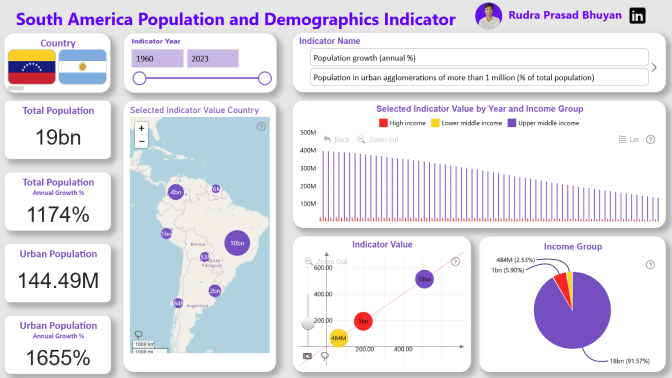
To better understand South America's urbanization, this challenge foces on six key indicators:
Population Growth (Annual %): Measures how quickly the total population is growing each year. A high growth rate can signal economic opportunities but also strain on resources.
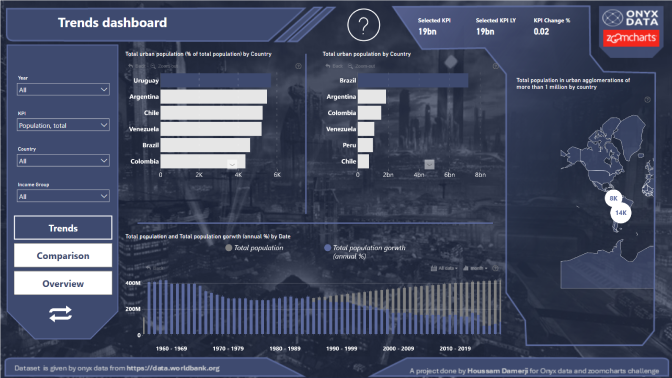
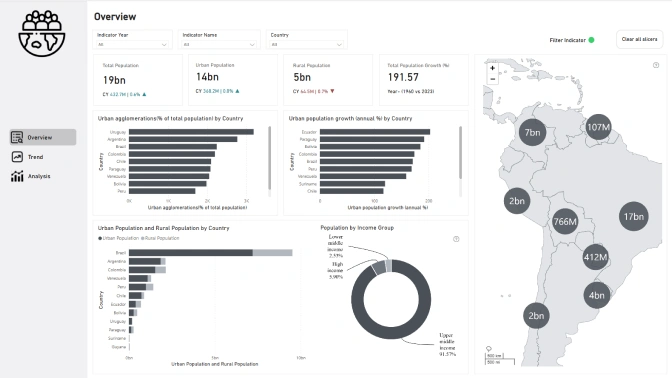
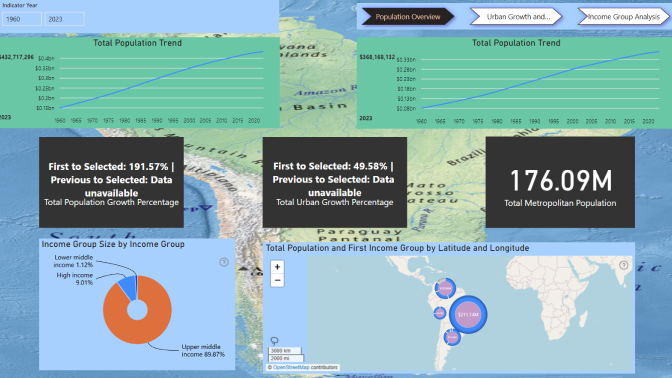
Urban Population (% of Total Population): Shows the share of people living in cities compared to rural areas. This helps track the extent of urbanization.
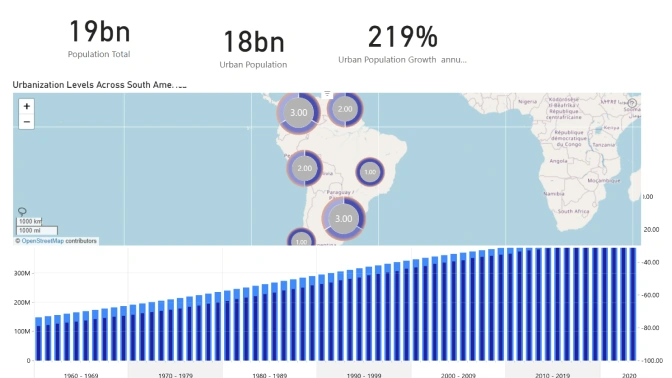
Urban Population (Absolute Numbers): Examines the total number of people living in urban areas, providing a sense of scale.
Urban Population Growth (Annual %): Tracks how fast cities are expanding. A rising rate may indicate migration trends, housing demand, or economic shifts.
Total Population: Provides a baseline to compare other indicators and assess overall demographic trends.
Population in Urban Agglomerations of More Than 1 Million (% of Total Population): Looks at how many people live in large urban centers with over one million residents. This highlights the concentration of people in major cities.
Understanding these trends can help policymakers, businesses, and communities plan for the future. By analyzing data, we can find ways to make cities more inclusive, efficient, and sustainable.
Source of the dataset: https://data.worldbank.org/topic/19
Each report is evaluated based on three main criteria: intuitiveness, insightfulness, and interactivity. These factors ensure that the reports are not only accurate and functional, but also meet the target audience's needs and are ready to be presented to the end-users.
Workshop | Smart Techniques for Urbanization Data Analysis in Power BI
Workshop | Smart Techniques for Urbanization Data Analysis in Power BI
13 February | 08:00
-
Webinar | Urbanization & Demographics Analysis: Top 5 Power BI Reports & Winner Reveal
Webinar | Urbanization & Demographics Analysis: Top 5 Power BI Reports & Winner Reveal
27 February | 09:00
31 January - 21 February