Video tutorials
More than 90 videos on how to enhance Power BI with ZoomCharts
Resources
Support
Challenges
Improve your report creation skills by participating in free challenges for report creators.
Contents
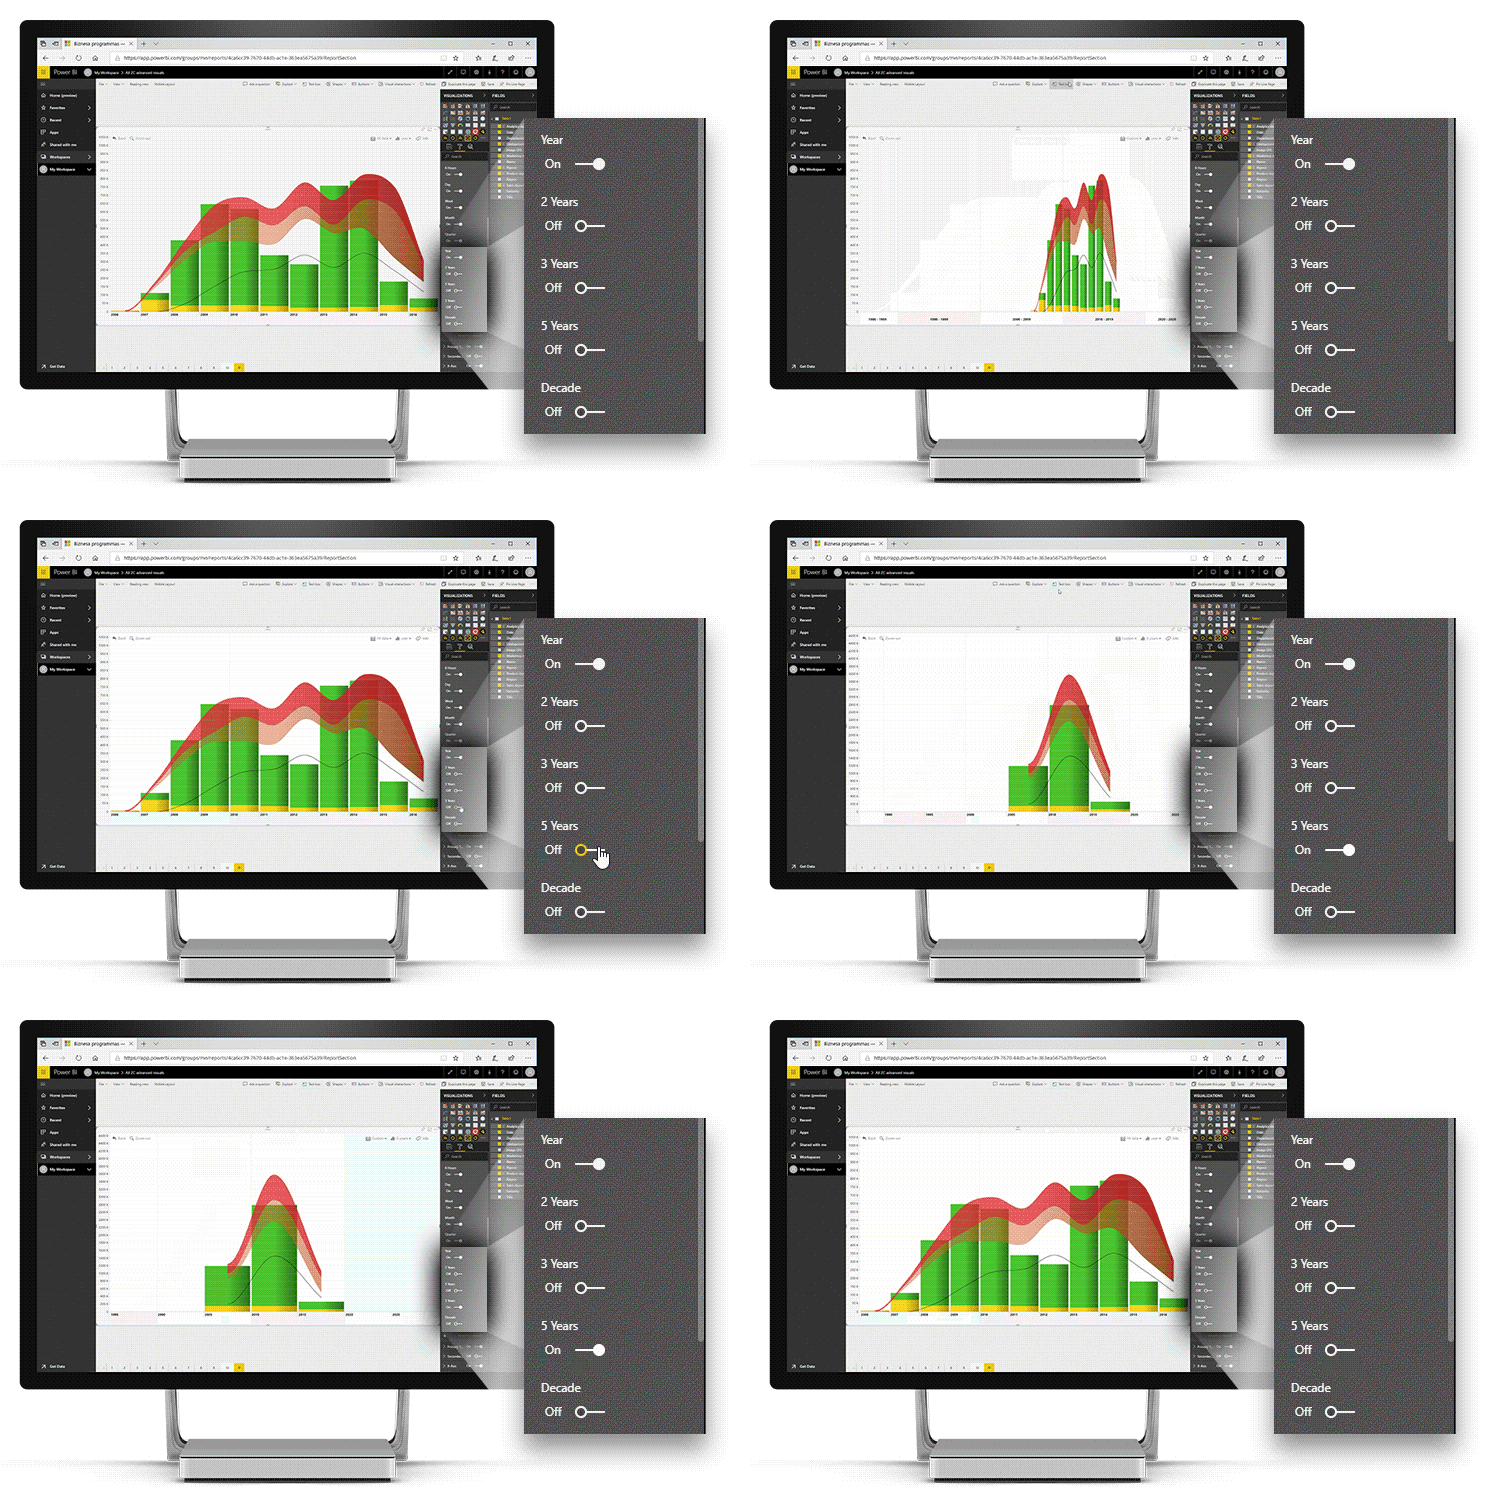
Interact with any part of the chart to drill-down to desired time span.
Benefits: display only relevant data. Data representation is neat and uncluttered.
Was this helpful? Thank you for your feedback!
How can we improve it?
Error message
Success info: Done!
For the best experience, we recommend upgrading to ensure that all website features display correctly.