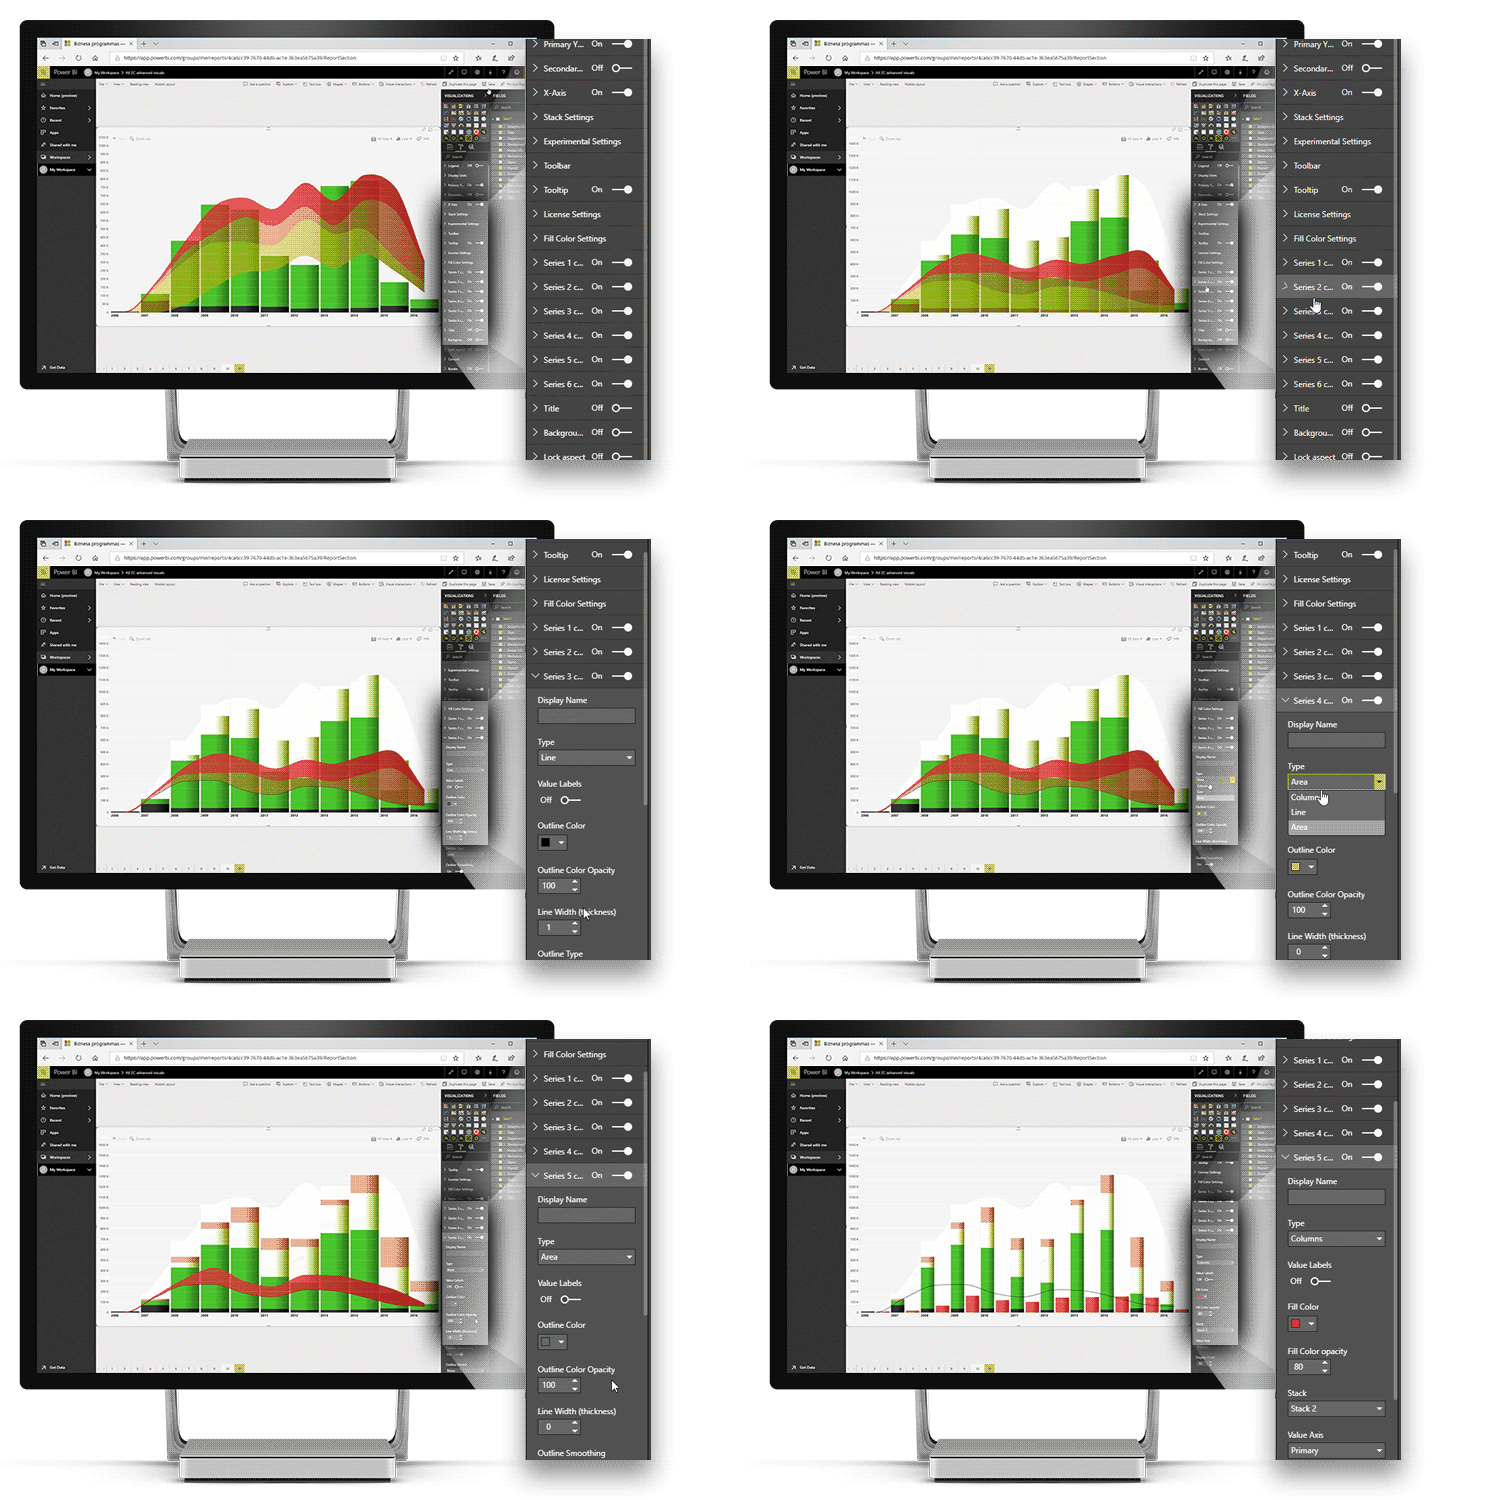
Adjustable Chart Types
Drill Down TimeSeries PRO allows you to mix & match three different chart types on the same chart – columns, lines, and areas. This way, you can pick the most suitable way to visualize your data depending on your requirements.
You can individually choose the chart type for each series. This setting (Type) is available in the Format visual tab under the Series Configuration menu.
Was this helpful? Thank you for your feedback!
Sorry about that.
How can we improve it?