Title Text
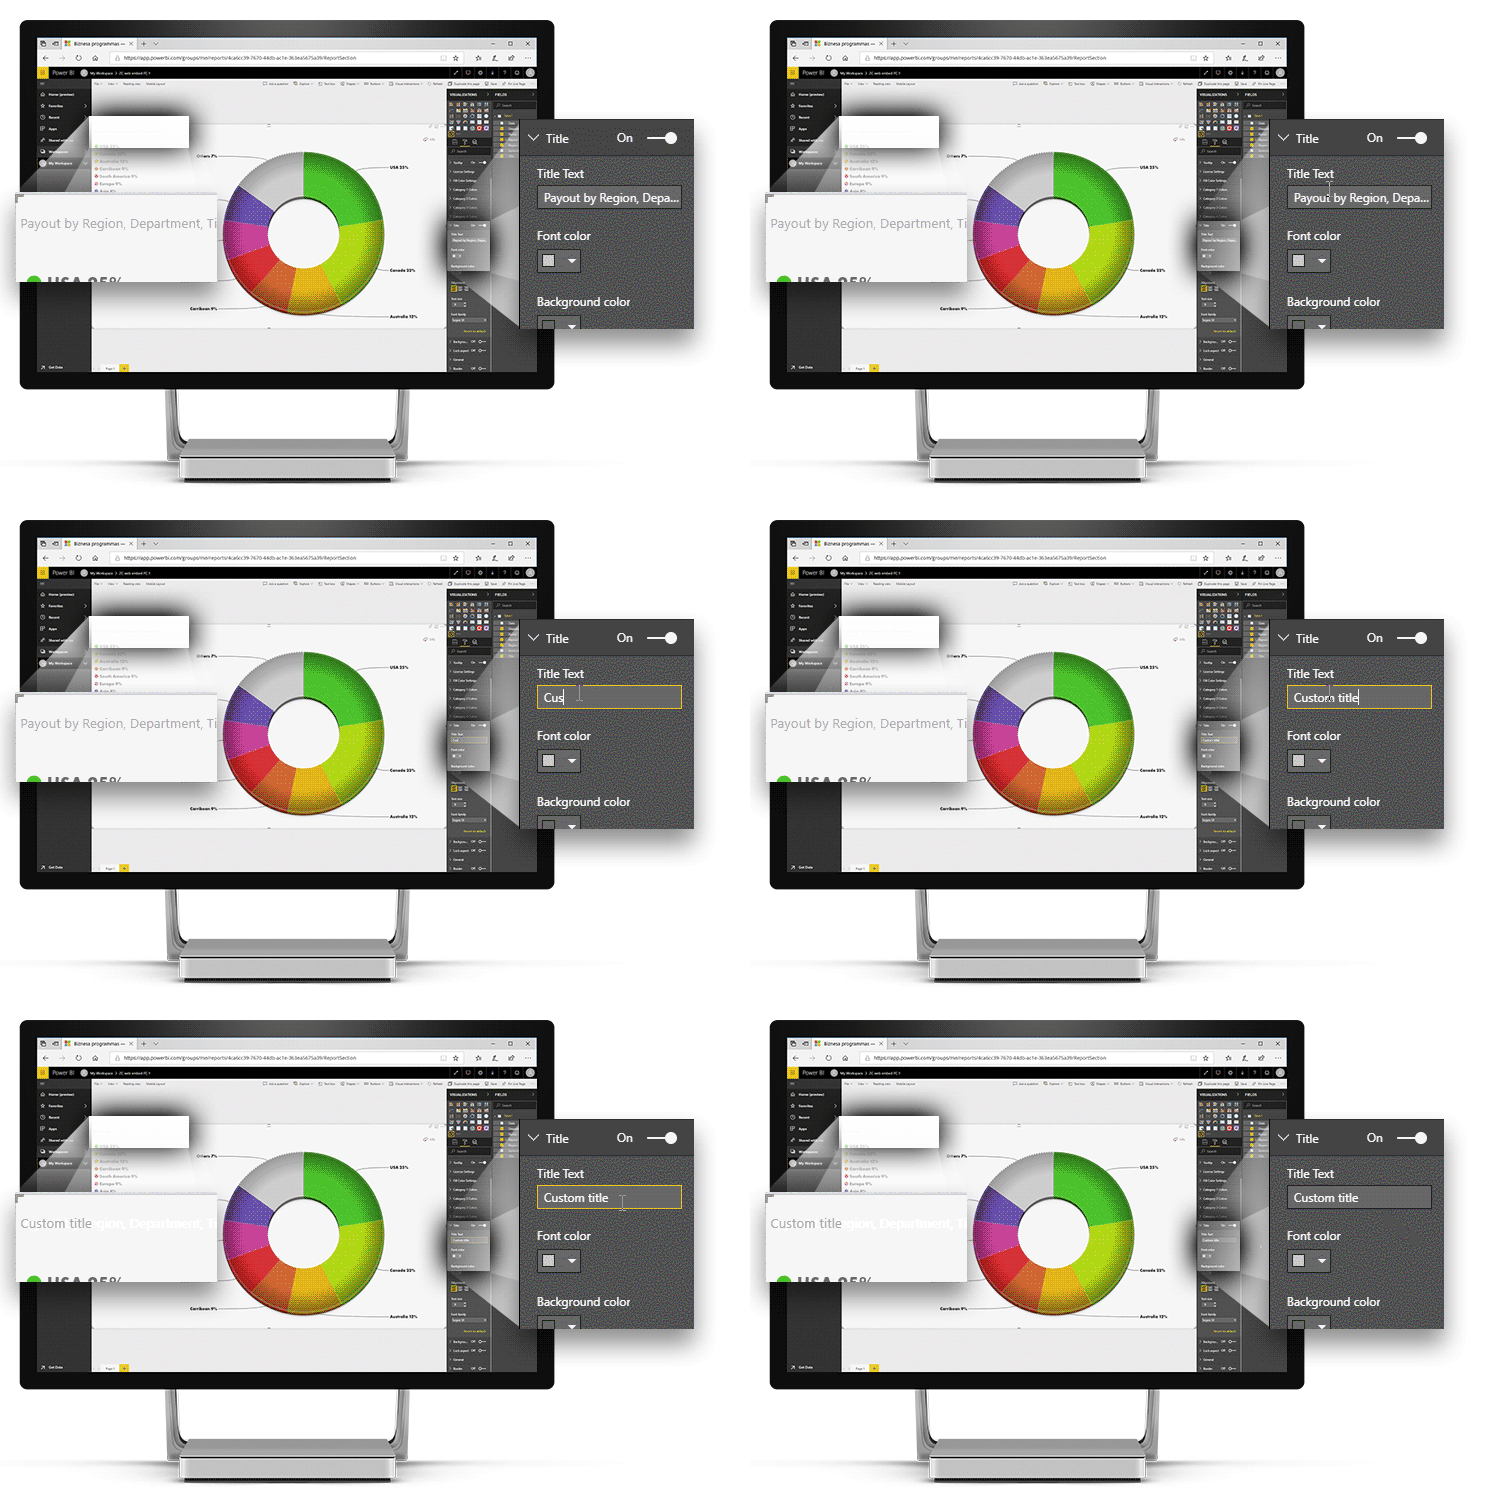
The custom visuals creates a default chart title which is based on series and date fields, that have been added to the chart.
If the default title does not quite suit your needs, you can change it by typing in an alternative title text.
Was this helpful? Thank you for your feedback!
Sorry about that.
How can we improve it?