Mar 19, 2015
ZoomCharts For National Conference on Emerging Trends in Information Technology: March 21, 2015
ZoomCharts is offering data visualization tools to support presenters at the National Conference on Emerging Trends in Information Technology, the theme of...
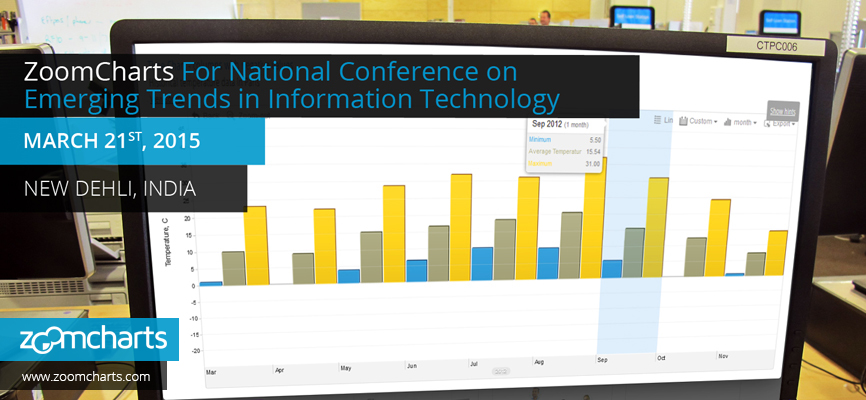

ZoomCharts is offering data visualization tools to support presenters at the National Conference on Emerging Trends in Information Technology, the theme of...
ZoomCharts is a leading data visualization provider, offering the world’s most interactive data visualization software. All charts and graphs are completely interactive, support big data sets, work on all modern devices including touch screens, and perform at incredibly fast speeds. Be among the growing number of professionals discovering the exciting potential that ZoomCharts has in improving the efficiency of data analysis and presentation.
Original papers being accepted at the cyber security conference include those by researchers, academicians, industrialists, and postgraduate students.
There is a wide range of topics being covered at the event, such as Cloud Security, Mobile and Web Security, Wireless Network Security, Social Networking Security and Privacy, Network Security and Cryptography, End Point Security, Biometrics, Anti-Forensic Techniques, Honeynet Technologies, SCADA Security, Cyber Threats and Trends, Firewall Management, Virtualized Machines, SOA Security Issues, and more.

Want more info like this?
Subscribe to our newsletter and be the first to read our latest articles and expert data visualization tips!
