Apr 03, 2015
ZoomCharts Sees Global Recognition as One of the Most Powerful Data Visualization Tools
ZoomCharts is enjoying international recognition, with impressed users as far reaching as countries such as Thailand.
An increasing number of professionals...
ZoomCharts is enjoying international recognition, with impressed users as far reaching as countries such as Thailand.
An increasing number of professionals...
ZoomCharts is enjoying international recognition, with impressed users as far reaching as countries such as Thailand.
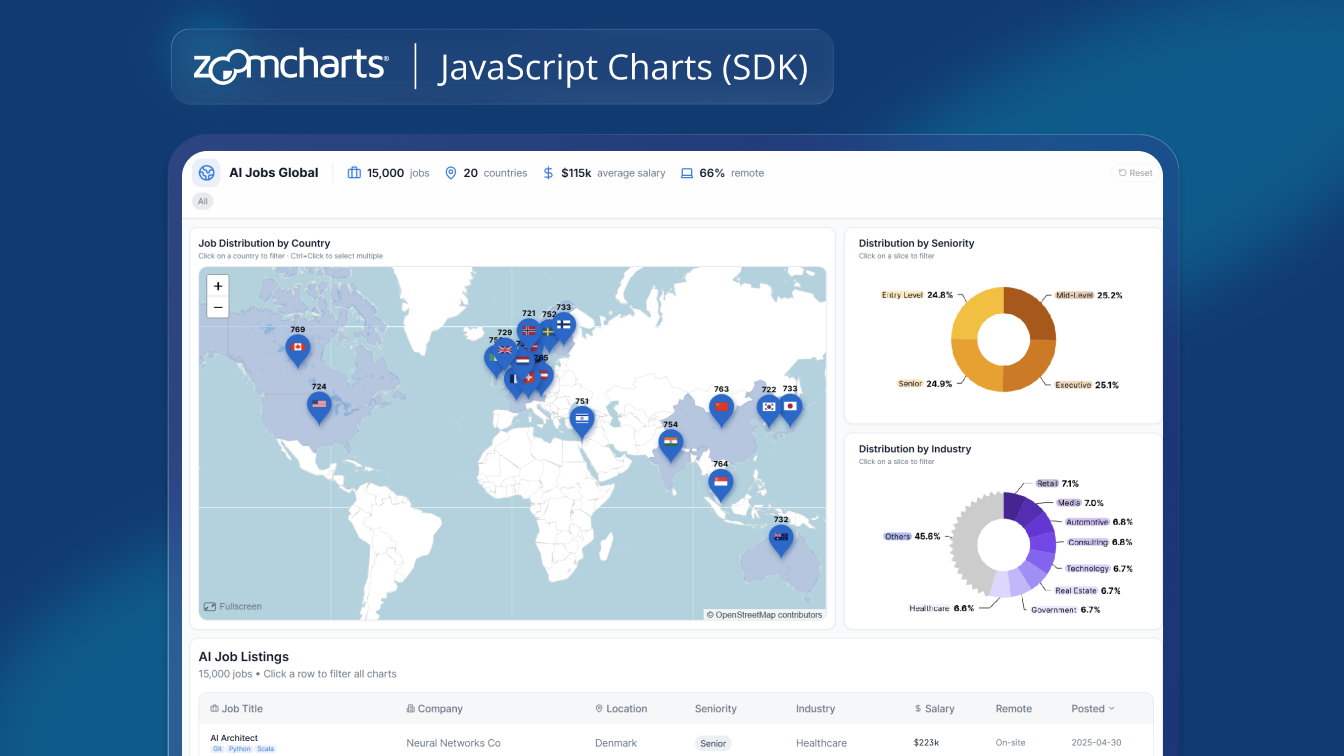
An increasing number of professionals in the world of business, technology, government, education, and more are discovering ZoomCharts, the world’s most interactive data visualization software, with completely interactive charts and graphs that support massive amounts of data, can be used with all modern touchscreen devices, and perform at incredibly fast speeds.
Try yourself! ZoomCharts charts and graphs are 100% interactive and very intuitive: https://zoomcharts.com/en/gallery/
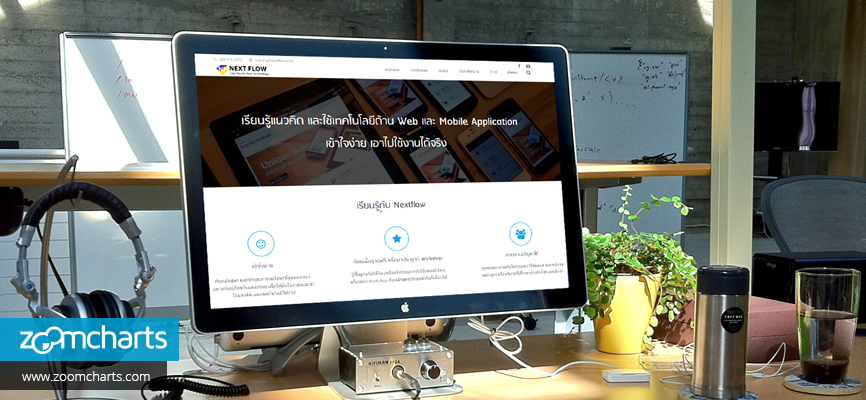
Thailand’s Next Flow, a group of creative technology experts, recommends ZoomCharts. Next Flow specializes in training users to save time by using technology most efficiently and effectively. And they use best tools that help them to achieve these goals of working faster and smarter.
Satisfied users of the software themselves, Next Flow dubs ZoomCharts tools to be among the best in the data visualization market. In a world where interactive HTML data visualization tools are widely available, they name it one of the most powerful, and visual providers.
Check out Next Flow at http://nextflow.in.th/2014/web-chart-for-html5-mobile-app-phonegap-cordova/
An increasing number of professionals in the world of business, technology, government, education, and more are discovering ZoomCharts, the world’s most interactive data visualization software, with completely interactive charts and graphs that support massive amounts of data, can be used with all modern touchscreen devices, and perform at incredibly fast speeds.
Try yourself! ZoomCharts charts and graphs are 100% interactive and very intuitive: https://zoomcharts.com/en/gallery/
Thailand’s Next Flow, a group of creative technology experts, recommends ZoomCharts. Next Flow specializes in training users to save time by using technology most efficiently and effectively. And they use best tools that help them to achieve these goals of working faster and smarter.
Satisfied users of the software themselves, Next Flow dubs ZoomCharts tools to be among the best in the data visualization market. In a world where interactive HTML data visualization tools are widely available, they name it one of the most powerful, and visual providers.
Check out Next Flow at http://nextflow.in.th/2014/web-chart-for-html5-mobile-app-phonegap-cordova/

Want more info like this?
Subscribe to our newsletter and be the first to read our latest articles and expert data visualization tips!