May 11, 2015
ZoomCharts Team at the Collision Event in Las Vegas on May 5 - 6, 2015
What a legendary event it was! ZoomCharts interactive data visualization software made heads turn and people talk, which resulted in a dramatic increase of our...
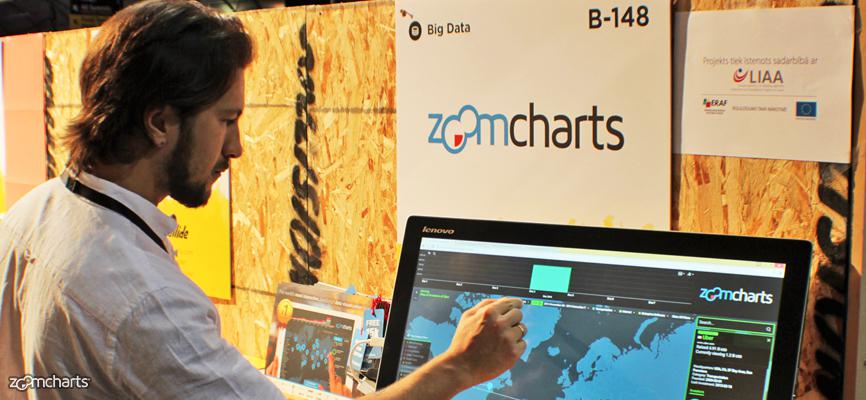

What a legendary event it was! ZoomCharts interactive data visualization software made heads turn and people talk, which resulted in a dramatic increase of our...
Because of the unique way presenters and researchers can interact with the ZoomCharts graphs and charts our users improve efficiency of their processes and minimize time spent on research and analysis. There are no products like that in the market.
Check out our gallery and try ZoomCharts for FREE: https://zoomcharts.com/en/gallery/
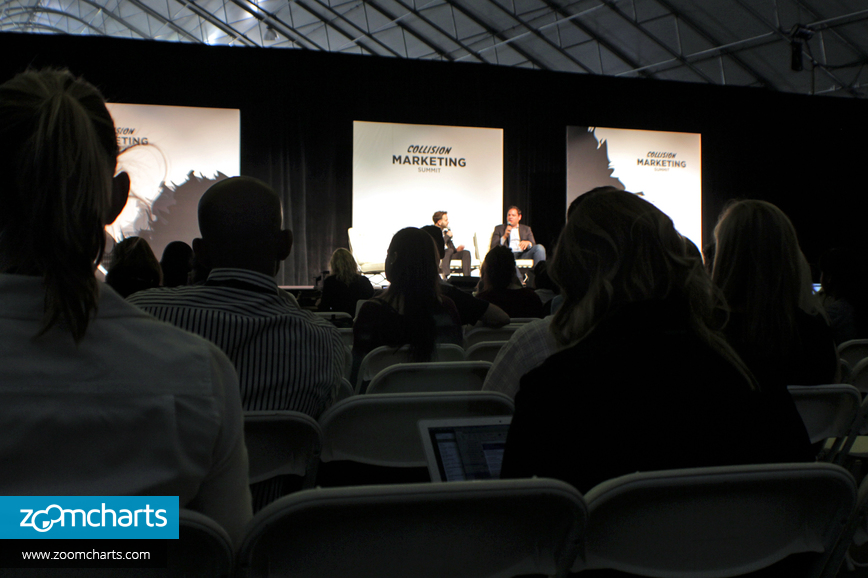

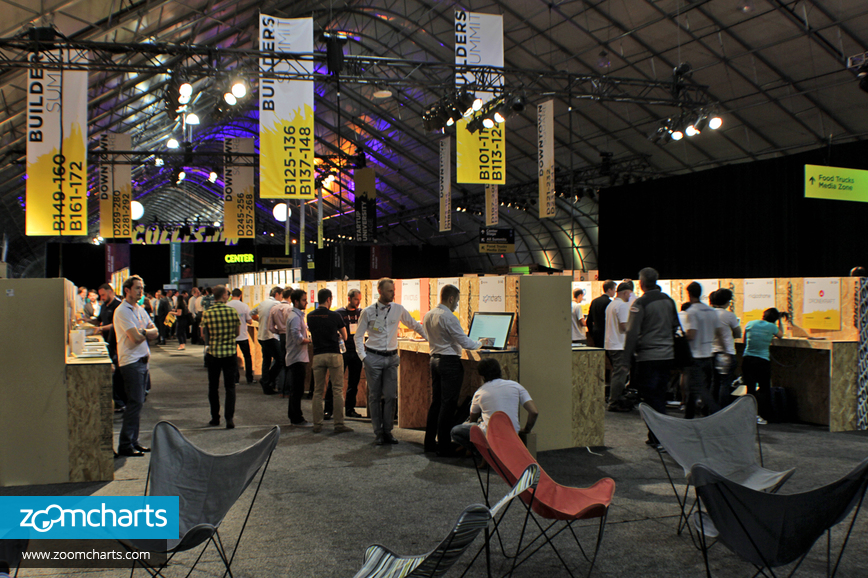
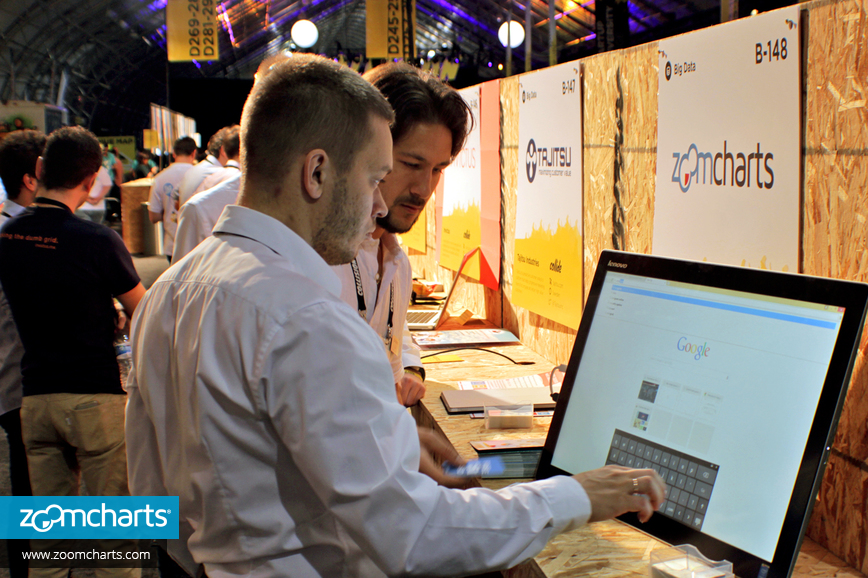
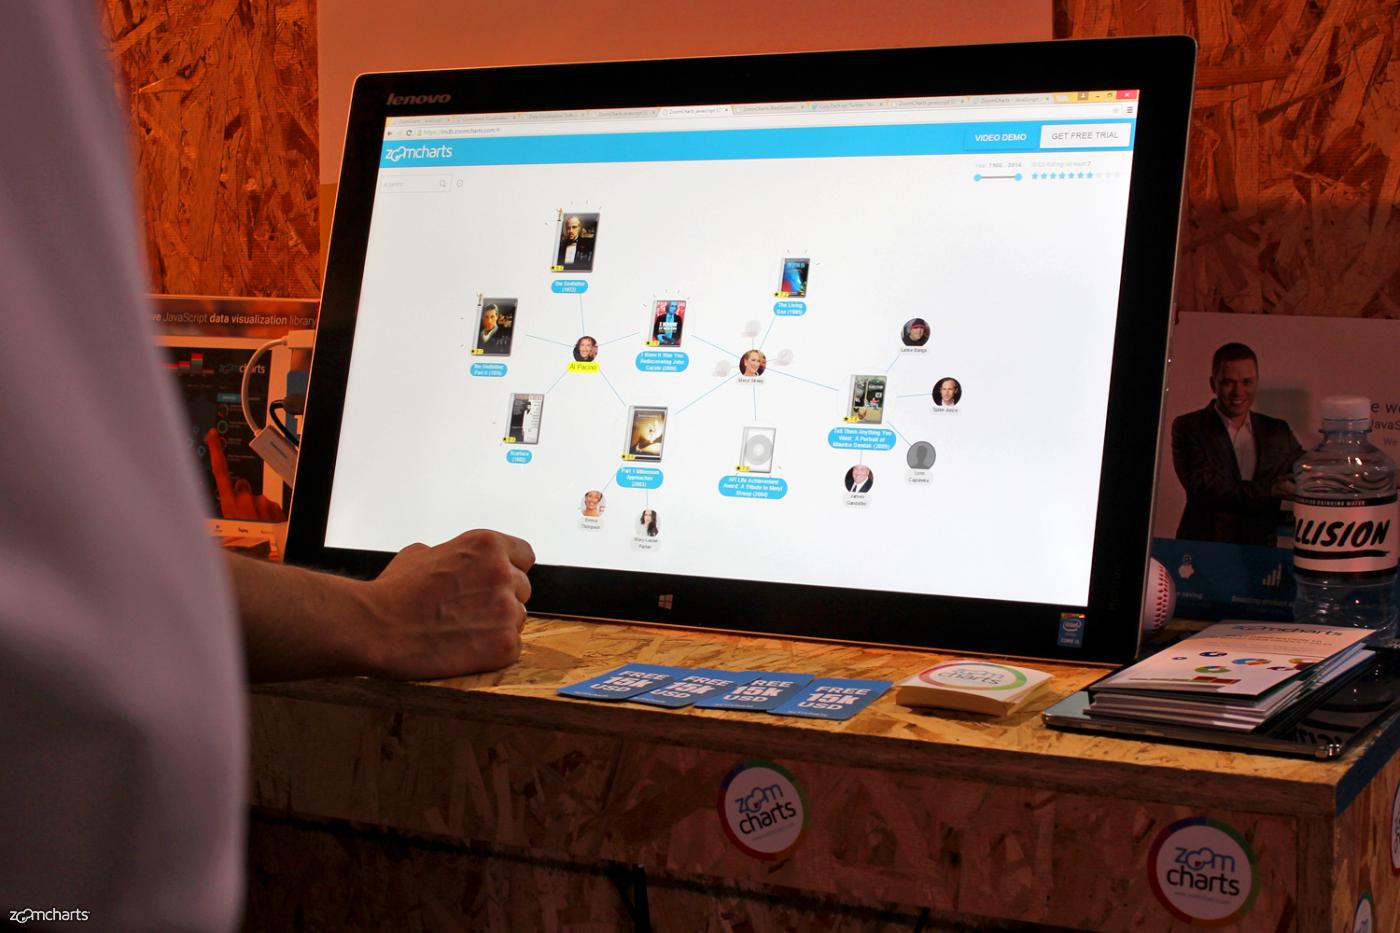
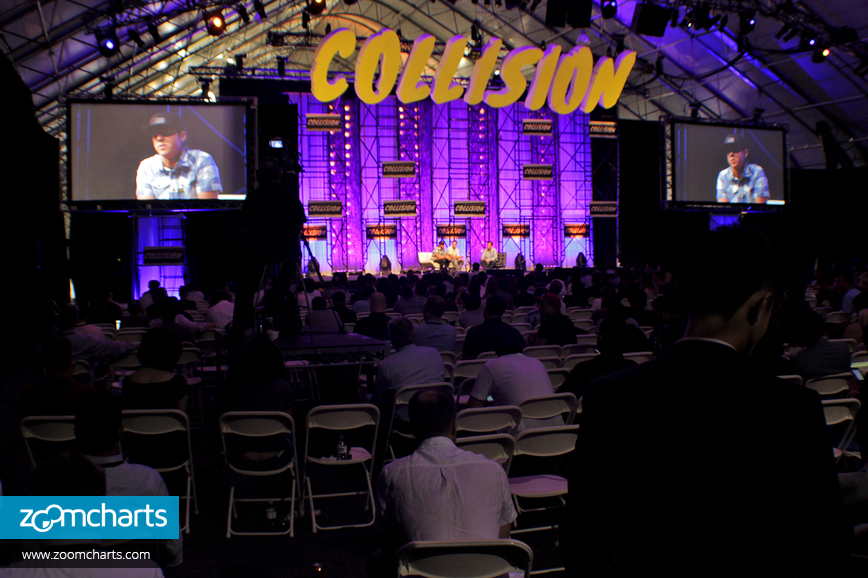
Here are all of the photos from the event: https://www.flickr.com/photos/zoomcharts/sets/72157652349494470
ZoomCharts participation in the event "Collision" is supported by Investment and Development Agency of Latvia (LIAA)

Data Visualization Software Lab ir noslēdzis 14.08.2015 līgumu Nr.L-ĀTA-15-3164 ar Latvijas Investīciju un attīstības aģentūru par projekta Nr.ĀTA/2.3.1.1.1/15/75/114 īstenošanu, ko līdzfinansē Eiropas Reģionālās Attīstības Fonds.

Want more info like this?
Subscribe to our newsletter and be the first to read our latest articles and expert data visualization tips!
