Feb 03, 2015
ZoomCharts for the DRIVE Conference: March 11-12, 2015
ZoomCharts is offering data visualization tools to support presentations at DRIVE/, taking place from March 11th to 12th, 2015 at the Hyatt Regency Bellevue on...


ZoomCharts is offering data visualization tools to support presentations at DRIVE/, taking place from March 11th to 12th, 2015 at the Hyatt Regency Bellevue on...
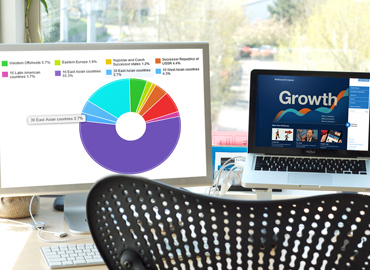
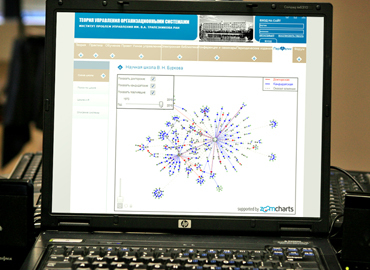
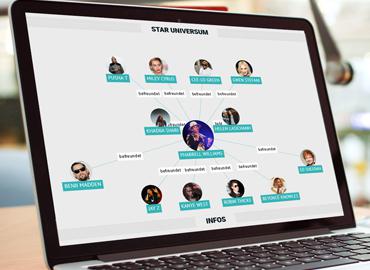
ZoomCharts’ line of advanced data visualization software is fully interactive, supports big data, works on all modern devices including touch screens, and does it all at incredibly fast speeds. These tools are being discovered by a growing number of clients in a variety of fields as the best way to analyze and present data. Don’t be among the last to discover the exciting potential that ZoomCharts tools can open up for your data.
DRIVE/ is an annual event attended by wide range of innovative IT and data professionals including higher education, non profit, and corporate sectors, such as Amazon, Adobe, Yale University, Harvard University, Columbia University, Bill & Melinda Gates Foundation, American Red Cross, Seattle Children’s Hospital, and many more. Experts in subjects such as data, reporting, information, analytics, modeling, and visualization speak and present for participants to learn new skills, participate, and be inspired by all things high tech.

Want more info like this?
Subscribe to our newsletter and be the first to read our latest articles and expert data visualization tips!
