Feb 12, 2015
ZoomCharts for SAP TechEd Bangalore 2015
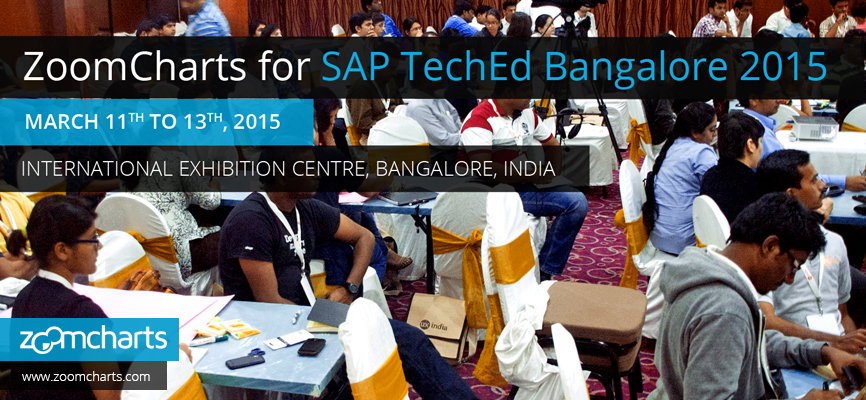
ZoomCharts is offering data visualization tools to support presenters at the SAP TechEd Bangalore 2015 conference, March 11-13th, 2015 at the Bangalore...


ZoomCharts is offering data visualization tools to support presenters at the SAP TechEd Bangalore 2015 conference, March 11-13th, 2015 at the Bangalore...
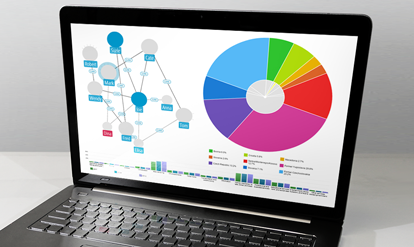
ZoomCharts’ line of advanced data visualization software is fully interactive, supports massive amounts of data, works with all modern devices including touch screens, and does it all at an incredibly fast speed, unmatched by any other visualization software of its kind. These tools are being explored by a growing number of clients in a variety of fields as the best way to analyze and present data. Don’t be among the last to discover the exciting potential that ZoomCharts tools can open up for your data.
As an information technology leader that is home to industries such as software and telecommunications, and as Asia’s fastest growing cosmopolitan city, Bangalore is India’s answer to Silicon Valley. SAP TechEd Bangalore 2015 will be host to thousands of developers, engineers, and tech professionals, offering lectures and workshops on topics such as analytics, big data, mobile, user experience, cloud management, security, and more. Some highlights of the event include keynote speakers, live coding events, product demos, and the chance to connect and network with speakers, mentors, developers, and IT experts.

Want more info like this?
Subscribe to our newsletter and be the first to read our latest articles and expert data visualization tips!


