Feb 02, 2015
ZoomCharts for DeveloperWeek: February 6-12, 2015
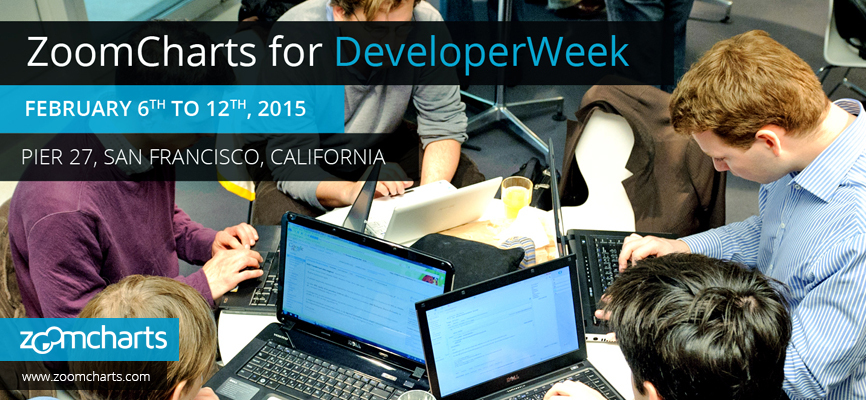
ZoomCharts is offering data visualization tools to support presenters at DeveloperWeek 2015, taking place from February 6th to 12th, 2015 at Pier 27 at the...


ZoomCharts is offering data visualization tools to support presenters at DeveloperWeek 2015, taking place from February 6th to 12th, 2015 at Pier 27 at the...
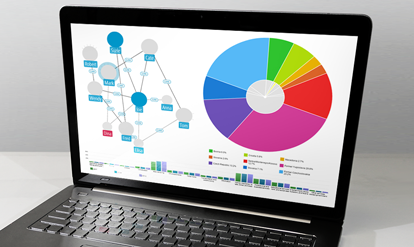
ZoomCharts’ line of advanced data visualization software is fully interactive, supports big data, works on all modern devices including touch screens, and does it all at incredibly fast speeds. These tools are being discovered by a growing number of clients in a variety of fields as the best way to analyze and present data. Don’t be among the last to discover the exciting potential that ZoomCharts tools can open up for your data.
DeveloperWeek is San Francisco’s largest technology event series. Covering new dev technologies, DeveloperWeek includes over 60 events, some of which include the Conference & Expo, the Accelerate 2015 hackathon, GirlDevWeek events, the Robotics Dev Summit, the DevOps Summit, workshops, and open houses.
Introductory lessons, advanced tips, and tricks are offered on technologies like HTML5, WebRTC, Full-Stack JavaScript development, mobile web design, Node.js, data science, distributed computing, and more. Hosts and supporters of last year’s event include a number of major technology industry players, including Google, Facebook, IBM, Blackberry, and Microsoft.

Want more info like this?
Subscribe to our newsletter and be the first to read our latest articles and expert data visualization tips!


