Mar 26, 2015
ZoomCharts Experience: Episode 1, Swipe & Pinch
This is the first installment in the new ZoomCharts Experience video series. These video shorts will continue on a regular basis to offer a fun, fast, and...


This is the first installment in the new ZoomCharts Experience video series. These video shorts will continue on a regular basis to offer a fun, fast, and...
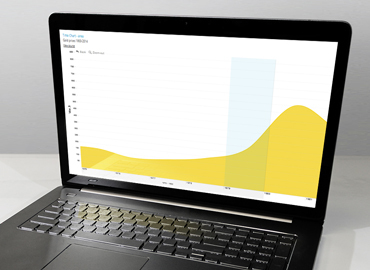
Tired of static data charts that don’t let you go deeper into the information you need to access?
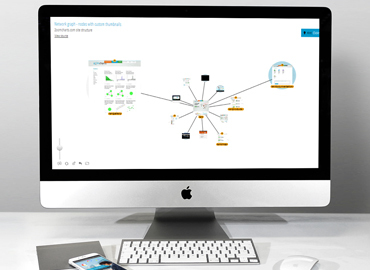
ZoomCharts makes it easy to drill down into your data, with interactive swiping and pinching features that let you easily scroll, zoom in, and zoom out to let you explore every part of your data, in one space.
Everything you need is available to you literally right at your fingertips.
Subscribe to the ZoomCharts Youtube channel and follow the video series to discover how ZoomCharts tools can be used to enhance your data visualization possibilities:
https://www.youtube.com/channel/UCWcwkDLDB_3SNJJPAsWOTPg
Feel free to explore how the chart works - it is 100% interactive and very intuitive to use.
ZoomCharts Time Chart - Mixed - Columns and Area
https://zoomcharts.com/en/gallery/all:time-chart/examples/gallery/mixed-timechart-columns-area-bitcoin-transactions-gradient

Want more info like this?
Subscribe to our newsletter and be the first to read our latest articles and expert data visualization tips!


