Dec 04, 2015
Starting Big at Web Summit 2015 in Dublin
The ZoomCharts team had an opportunity to attend Web Summit 2015 on November 3-5 in Dublin, one of the largest technology conferences in the world. The...


The ZoomCharts team had an opportunity to attend Web Summit 2015 on November 3-5 in Dublin, one of the largest technology conferences in the world. The...
The event gathered over 42,000 attendees from 134 countries, including 2,100 startups representing 17 industries. The only thing emerging in our minds while preparing for the event was how to stand out in such a big event? So we showed up with our new slogan START BIG.
We believe that to make the right decisions, you have to start with the big picture first. And then zoom into details. That's what we at ZoomCharts do! We offer interactive JavaScript and HTML5 chart and graph library to visualize your company's data, so you can see the big picture and make your data easy to explore on touch-screen devices and web applications.
And that's exactly what businesses need today! And will need even more tomorrow. We received extremely positive feedback about our product both at the exhibition and on the pitch stage. ZoomCharts was one of the 200 startups shortlisted for the Web Summit PITCH.
Here you can see our CEO Janis Volbergs presenting at the pitching contest.
Heve you ever visited Web Summit? How was your experience? Let's have a closer look at the ZoomCharts team at Web Summit 2015 in Dublin.

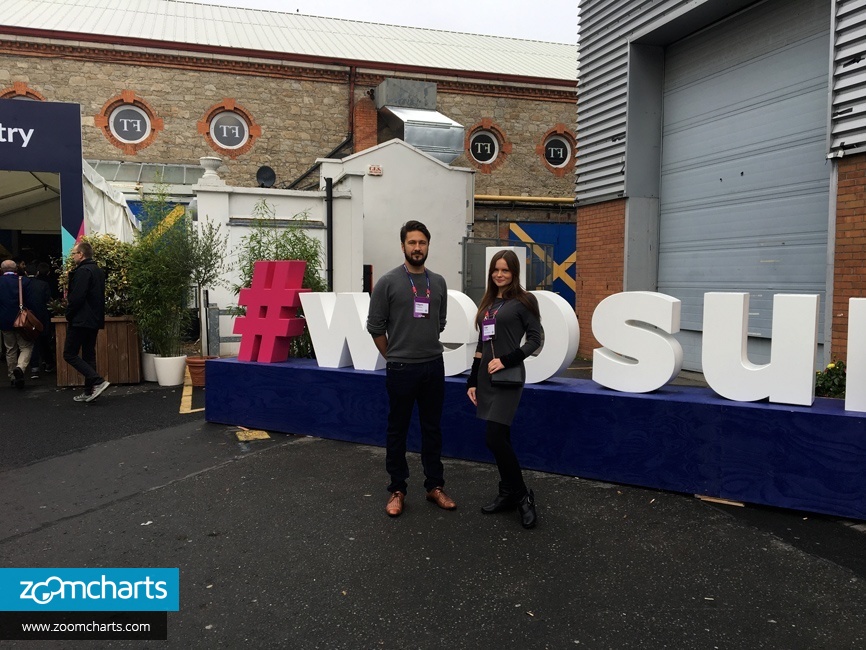




ZoomCharts participation in the event “Web Summit” is supported by Investment and Development Agency of Latvia (LIAA).


Want more info like this?
Subscribe to our newsletter and be the first to read our latest articles and expert data visualization tips!

