Mar 03, 2015
How to Use Pie Chart - Donut Chart, Flat Theme, Hierarchical Structure
https://zoomcharts.com/en/gallery/all:pie-chart/examples/gallery/pie-chart-donut-chart-flat-csdd-car-market ZoomCharts’ advanced data visualization line...


https://zoomcharts.com/en/gallery/all:pie-chart/examples/gallery/pie-chart-donut-chart-flat-csdd-car-market ZoomCharts’ advanced data visualization line...
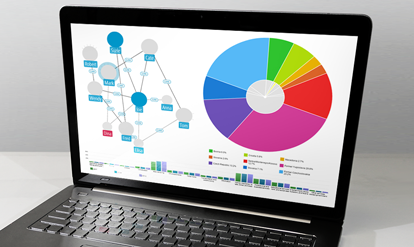
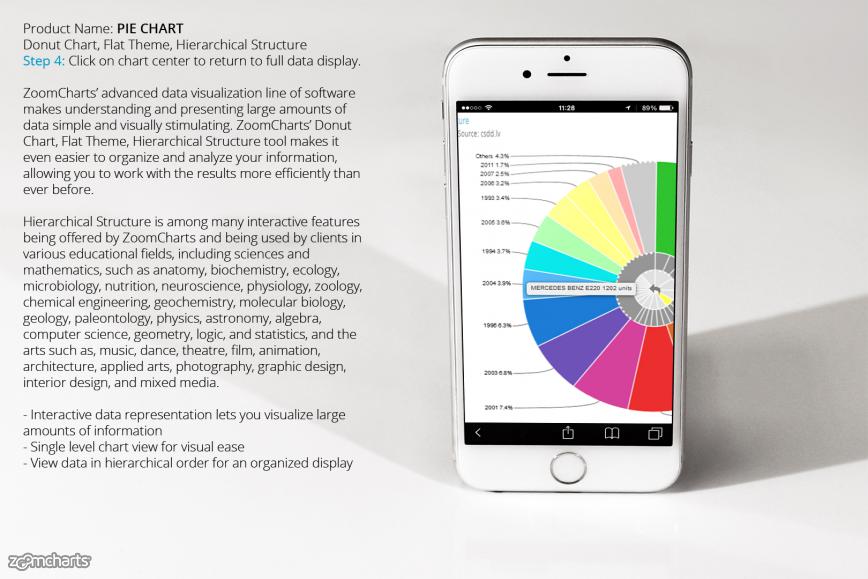
ZoomCharts’ advanced data visualization line of software makes understanding and presenting large amounts of data simple and visually stimulating. ZoomCharts’ Donut Chart, Flat Theme, Hierarchical Structure tool makes it even easier to organize and analyze your information, allowing you to work with the results more efficiently than ever before.
Hierarchical Structure is among many interactive features being offered by ZoomCharts and being used by clients in various educational fields, including sciences and mathematics, such as anatomy, biochemistry, ecology, microbiology, nutrition, neuroscience, physiology, zoology, chemical engineering, geochemistry, molecular biology, geology, paleontology, physics, astronomy, algebra, computer science, geometry, logic, and statistics, and the arts such as, music, dance, theatre, film, animation, architecture, applied arts, photography, graphic design, interior design, and mixed media.
- Interactive data representation lets you visualize large amounts of information
- Single level chart view for visual ease
- View data in hierarchical order for an organized display
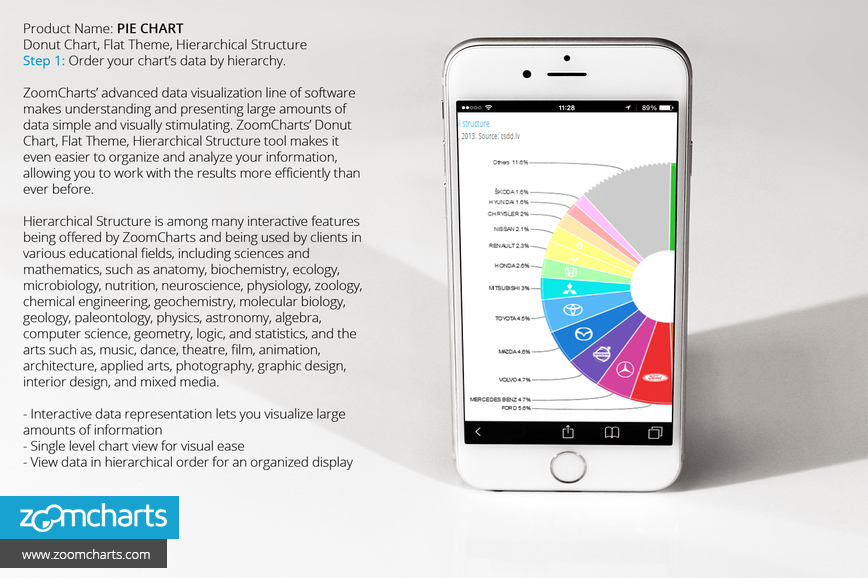
Step 1 Order your chart’s data by hierarchy.
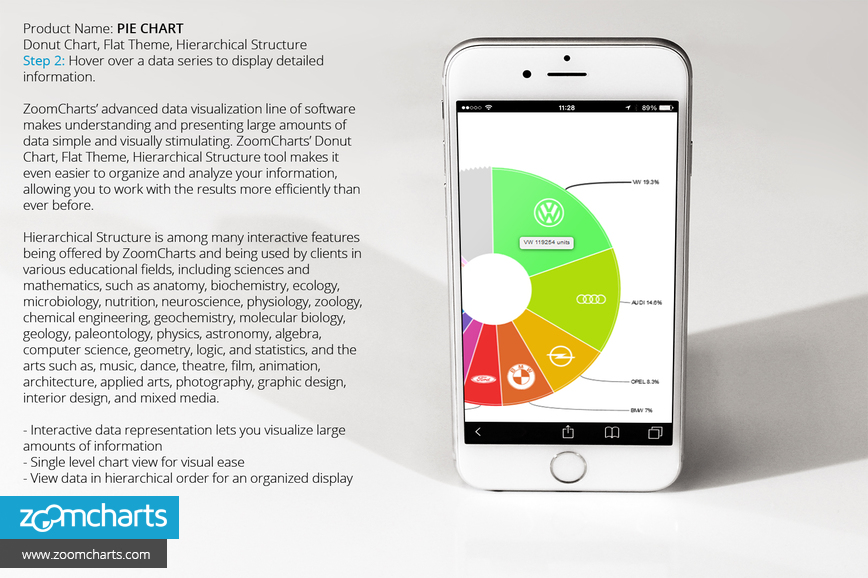
Step 2 Hover over a data series to display detailed information.
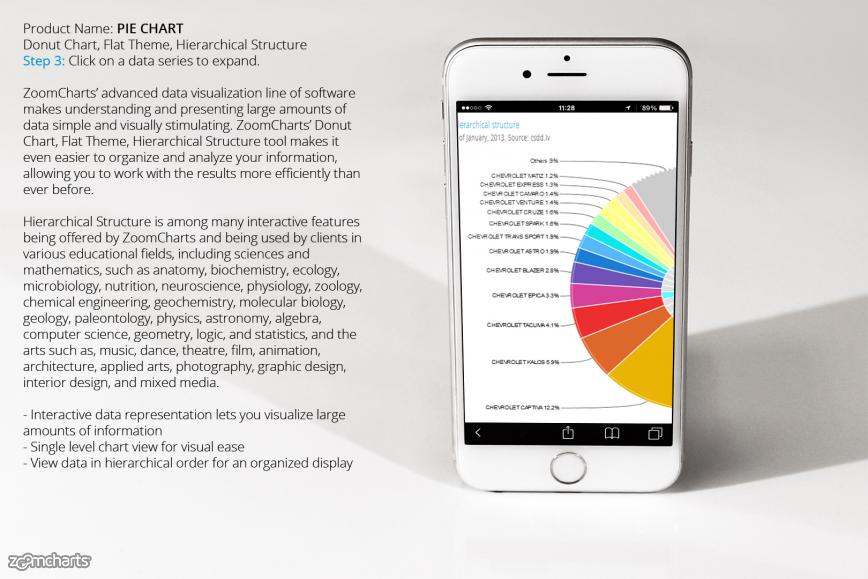
Step 3 Click on a data series to expand.
Step 4 Click on chart center to return to full data display.

Want more info like this?
Subscribe to our newsletter and be the first to read our latest articles and expert data visualization tips!


