May 21, 2015
Avoid Common Presentation Pitfalls with ZoomCharts
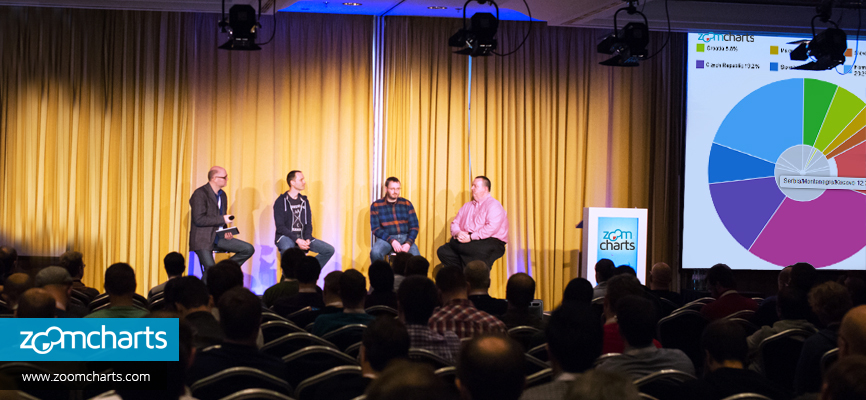
Presentations are a highly stressful part of life for many. Whether in school, on the job, at events or conferences, or in front of an interview panel, having...


Presentations are a highly stressful part of life for many. Whether in school, on the job, at events or conferences, or in front of an interview panel, having...
Especially in a world where an overwhelming amount of new data is available to us at every minute, presentations can quickly become frustrating and difficult to organize.
Break free from debilitating performance anxiety, increased stress, and even depression stemming from the demands of giving a presentation that can, in extreme cases, even lead to destructive behaviour.
Instead, go into your presentations confident, calm, and prepared, and enhance the possibilities of your presentations with tools that make it a cinch to deliver engaging, easy to understand, and visually appealing data.
ZoomCharts is the world’s most interactive data visualization software, offering 100% interactive charts and graphs that support massive amounts of data, can be used with all modern touchscreen devices, and works with incredibly fast performance speed.
An increasing number of professionals in fields such as business, technology, finance, sales, marketing, government, research, education, and more are discovering the exciting potential ZoomCharts has in taking presentations to a new level.
Impress audiences with presentation charts that allow you to:
• Add stunning visuals to your data
Engage your audience with a vibrant, appealing, and efficient presentation with visual information that is easier to consume than words and numbers.
ZoomCharts’ modern offerings of classic pie charts, time charts, network graphs, and bar graphs replace dull Excel spreadsheets and time consuming, manually made static data charts, allowing your audience to spend less time attempting to decode your data, and more time understanding it.
• Access your data from any desktop or mobile device
Fully responsive charts and graphs make for presentations that can go anywhere with you.
Deliver full presentations from your computer, laptop, tablet, and even from your smart phone while on the go, to support your busy lifestyle.
• Intuitively explore your data
With software that instantly responds to your every touch, a simple click, tap, swipe, or pinch can take you from a big picture overview look at your information to an in depth look at individual data sets, in mere seconds.
Access your entire data set in one convenient space, and skip the hassle of searching for slides, flipping between multiple spreadsheets, or fumbling with stacks of paper.
With ZoomCharts tools, presentations don’t have to be a thing to fear, but a way to free yourself from past anxieties and open up new and stimulating ways to deliver data to any type of audience.

Want more info like this?
Subscribe to our newsletter and be the first to read our latest articles and expert data visualization tips!


