Drill Down Combo PRO for Power BI
Fulfil your BI needs with intuitive and user-friendly data visualization solutions.
"The Advanced Visuals enable Power BI users
to enjoy data and achieve more!"
Product Manager, Power BI, Ranin Salameh


Main Features
Add a never-before-seen visual appeal to your data
Multiple chart types
Build your perfect visual with a combination of column, line, and area charts. Feature up to 25 different series and unlimited categories within a single chart.
Learn moreStacks & clusters
Lay out your data exactly how you want. Stack multiple values in a single column, overlay them on top of each other for a comparison, or show them side-by-side. In addition, you can decide between normal, zero-based or 100% stacking.
Learn moreThresholds
See how your numbers stack up against KPIs, benchmarks, or projections by setting static or dynamic thresholds. You can feature up to four different thresholds simultaneously.
Learn moreConditional formatting
Set conditions that will automatically apply custom formatting settings to your data. For example, you can mark your columns, areas or lines red if they are below the threshold, or green if they’re above.
Learn moreNo-data policy
Choose how the chart displays values with no data. You can pick between 3 options: Join to extend the data over that gap, Zero to replace the empty space with a zero value, or Skip to stop and begin the one at the next point.
Learn moreCross-chart filtering
Leave slicer menus in the past! Drill Down Combo PRO works together with other ZoomCharts visualization tools so you can create truly interactive and easy-to-use reports that will make finding relevant data a breeze.
Learn moreBookmark support
Create bookmarks that will show your users exactly the data they need to see. Simply capture a specific view and add convenient shortcut buttons to your report.
Learn moreFully customizable
Add your own creative flair to your reports or make it fit your brand guidelines with a wide range of customization options, including color, background, and label formatting, or even custom theme support.
Learn moreInvert selection
Click and hold to select data, and triple-click to invert your selection. This way, you can quickly select all data except specific categories.
Learn morePin to Dashboard
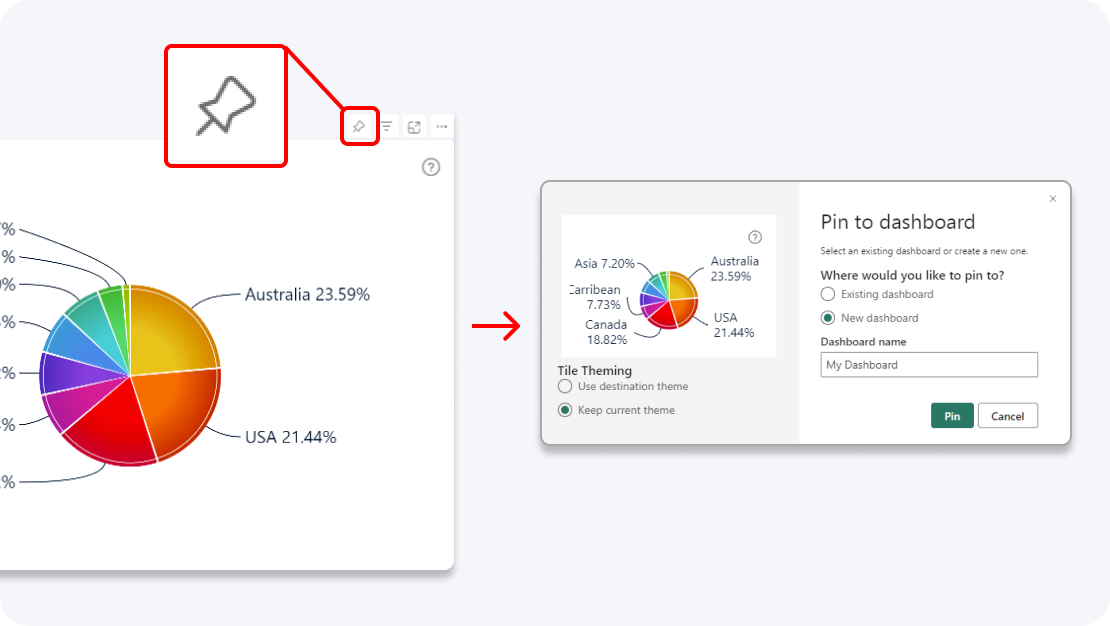
Enhance your dashboard with a stunning visual! Drill Down (Pin) supports the ability to pin the visual as a tile in Power BI dashboards.
Learn more