Dec 22, 2022
ZoomCharts JavaScript Charts: Best New Features of 2022
2022 was a big year for data visualization, and it was an even bigger year for ZoomCharts JavaScript Charts. We implemented many useful and much-requested features such as conditional formatting, new data aggregation options, and more. We’re even more excited to share the upcoming features that you can expect in 2023. Read all about them!
2022 was a big year for data visualization, and it was an even bigger year for ZoomCharts JavaScript Charts. We implemented many useful and much-requested features such as conditional formatting, new data aggregation options, and more. We’re even more excited to share the upcoming features that you can expect in 2023. Read all about them!
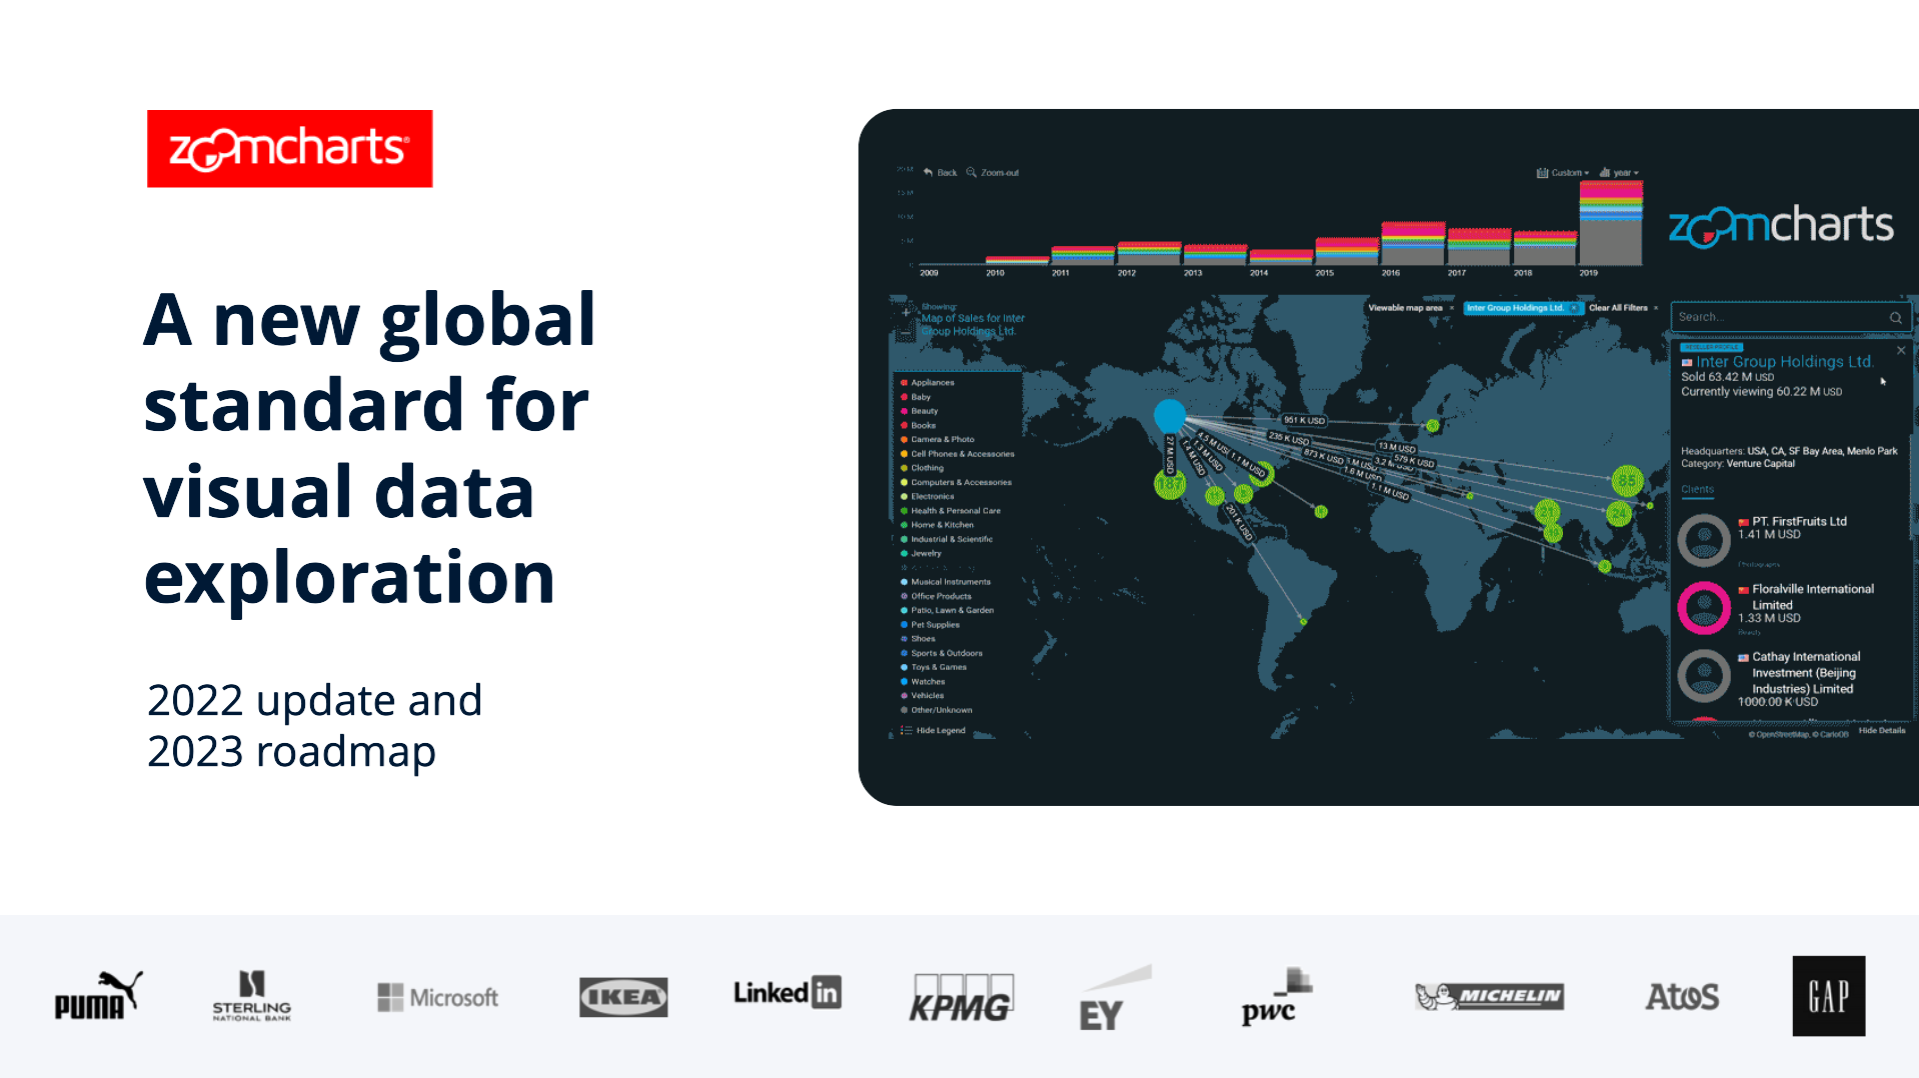
This article is a brief overview of the brand-new features that we added to ZoomCharts JavaScript Charts in 2022, and a rundown of the most exciting additions that you can expect over the course of 2023. If you are interested in an even deeper dive, watch the recording of the webinar “2022 update and 2023 roadmap”!
About ZoomCharts JavaScript Charts
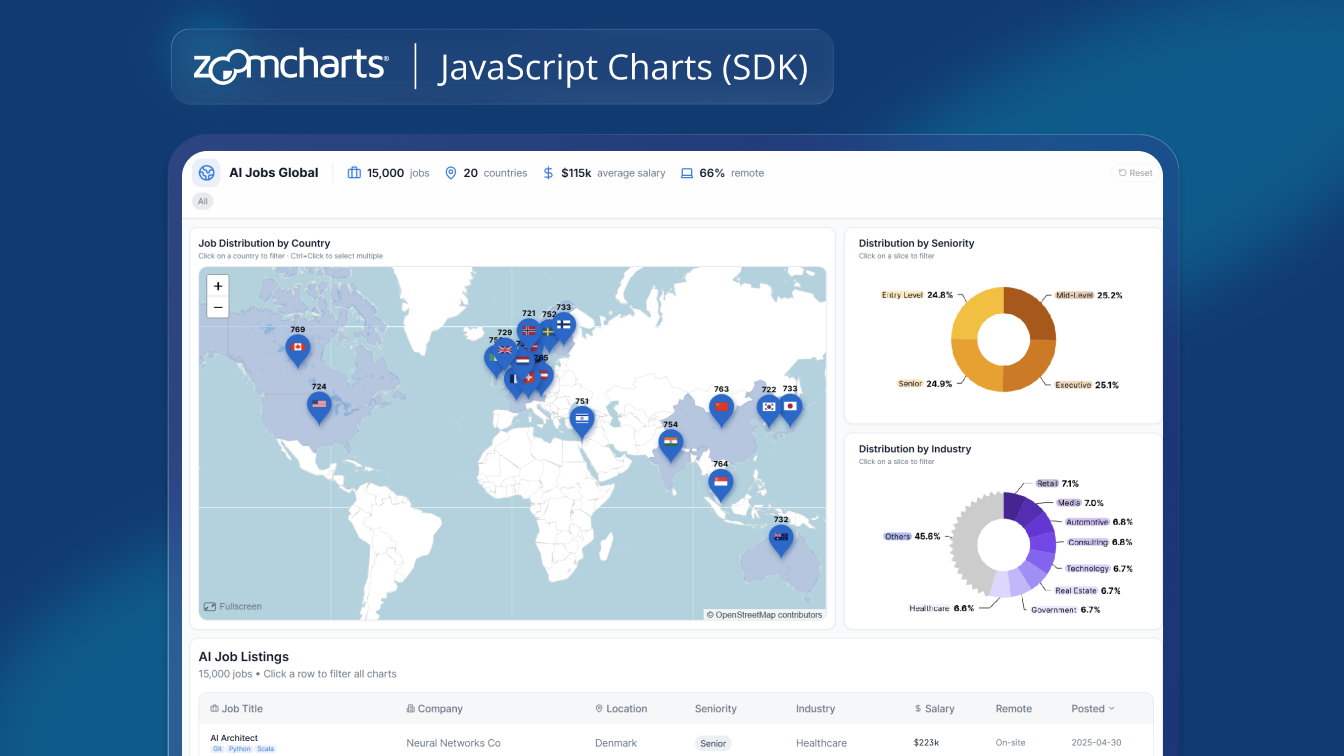
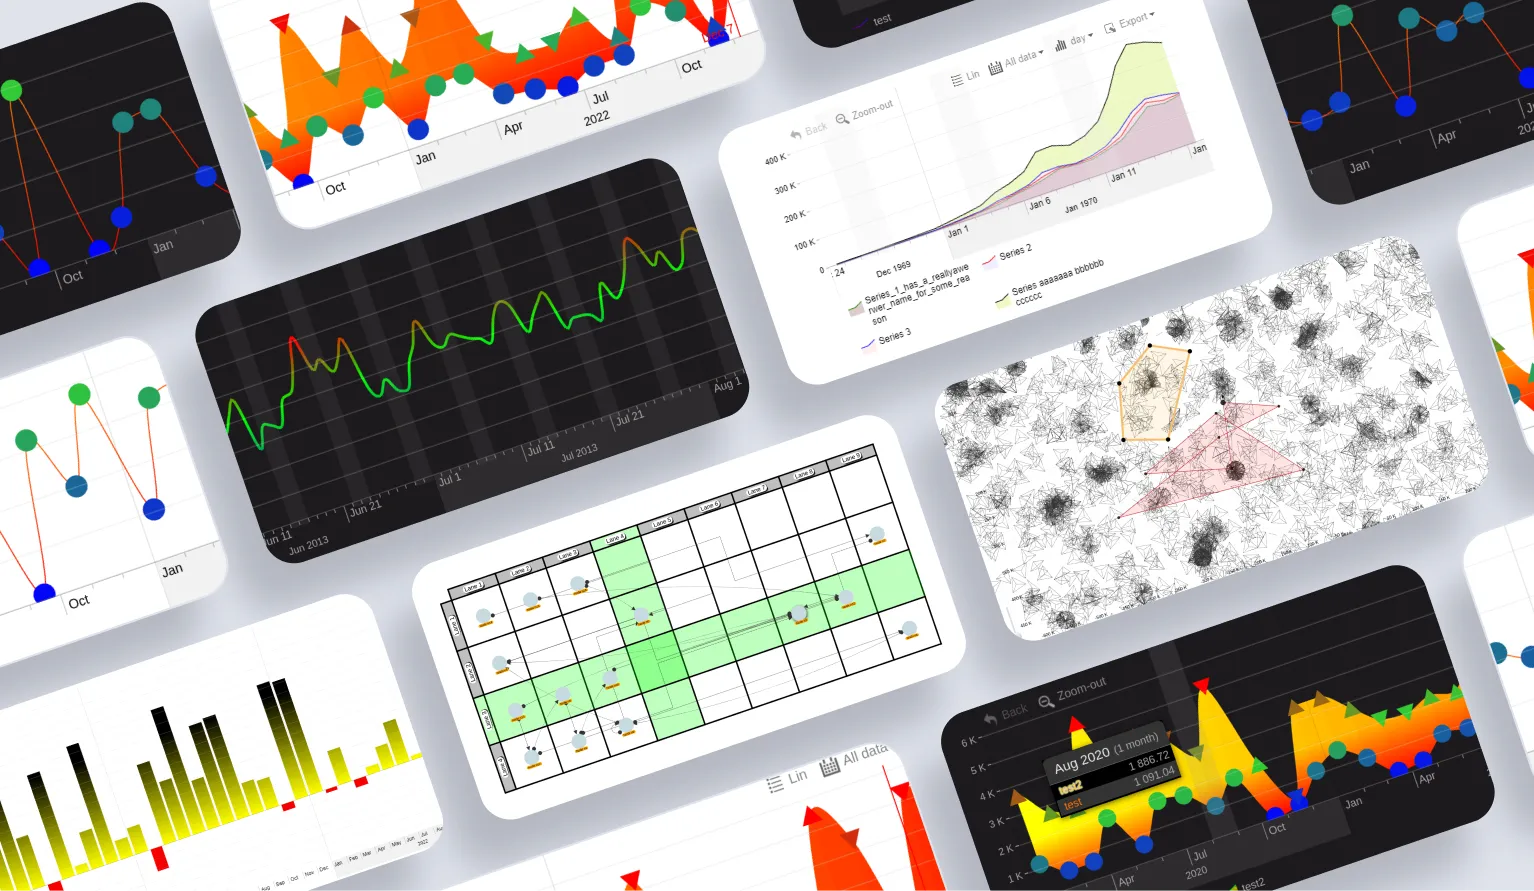
ZoomCharts JavaScript Charts is a family of powerful data visualization tools for web developers. It contains five versatile packages – Pie Chart, Facet Chart, Time Chart, Net Chart, and Geo Chart. These visuals are designed to provide intuitive user experience and actionable insights for everyone.
Experience smooth and touch-friendly user interface that makes filtering, drilling down and other on-chart interactions a joy. These charts are optimized to deliver smooth 60 frames per second experience that are just as great to navigate on touch devices as they are with mouse and keyboard.
2022 Additions to ZoomCharts JavaScript Charts
This was a big year for ZoomCharts JavaScript Charts. Over the course of 2022, we introduced several exciting and much-requested features to all our charts. We also gave the first public glimpse at Net Chart v2. Here’s a brief overview of the most significant additions!
Conditional Formatting
With conditional formatting, you can apply certain formatting rules depending on your predefined criteria. You can use this feature in Time Chart and Facet Chart visuals, and it adds a way to enhance your data storytelling capabilities without much effort.
One of the most prominent ways to use it is by adding color and gradient formatting rules to columns, lines, or areas in correlation with the value. For example, on a financial timeline chart you can automatically mark the periods which exceeded your KPIs green, but those that fell below it red. Or, if you’re creating a weather chart, you can create a gradient that gets progressively bluer as the temperature gets colder, or, conversely, redder as it gets hotter.

There are various other settings that conditional formatting can affect. For example, you can make tooltip labels change their colors in accordance with the values on the chart; moreover, shadows can be applied to those dynamically colored tooltip labels for better color separation. Furthermore, conditional formatting can adjust the size of the value markers. For example, you can make it so the larger values have larger markers accordingly to call attention to them.

Conditional formatting is a massive time-saver, allowing you to increase the saliency of your charts and enhance data storytelling capabilities with just a few lines of code. We encourage you to play around and find out how you can use this handy feature in your charts – the rest is up to you and your creativity!
Threshold Value Function
Another useful addition that you can use for your data visualizations in Time Chart and Facet Chart is the brand-new thresholds value function feature. With it, you can configure threshold value labels more dynamically, and apply custom formatting to better satisfy your reporting needs.

New Data Aggregation Features
Custom aggregation functions give you control of how your data is aggregated at every level and time range. A TimeChart could show a city's average temperature at the months level, but at the days level, it could show the midday temperature someone would actually experience on that day. This way you can always see the most relevant view of your data even when what's relevant depends on the current time unit or time range.
Time Chart Scroll Buttons
One much-requested quality-of-life addition that will make the navigation easier is the scroll buttons feature on Time Chart. Previously, if you wanted to navigate the timeline, you had to drag your mouse cursor or finger horizontally. Now developers have the option to add convenient navigation buttons that will scroll the timeline in previously defined increments.

Word Wrap for Legends
Another feature we’ve introduced is word wrap for legends. Before, if your chart legends were URLs or simply very long words, the default behavior was either shortening them with an ellipsis or overflowing them out of bounds. With word wrap, even the most supercalifragilisticexpialidocious words will be automatically separated and carried over to the next line.

Swimlane Layout in Net Chart
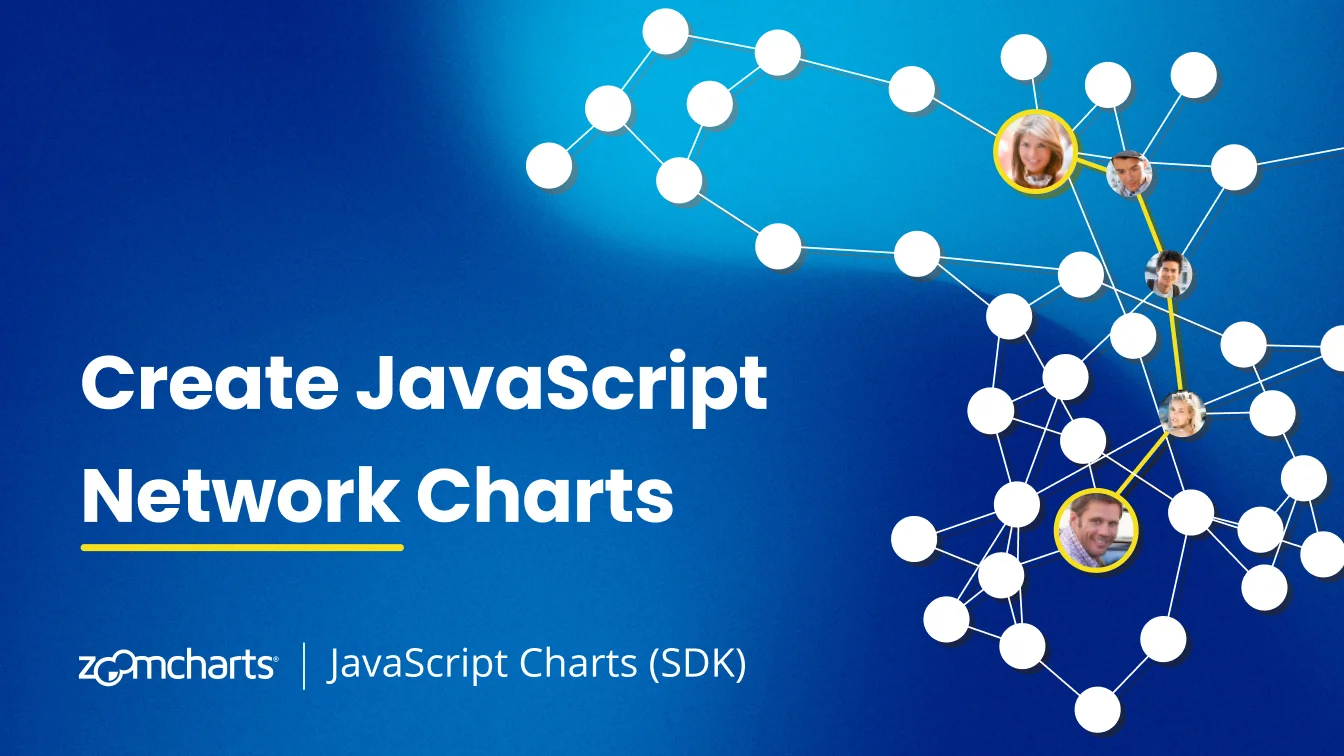
We have introduced various useful features in Net Chart during 2022. Along with performance improvements, they are available to Net Chart v1 users. One of them is the brand new swimlane layout, which enables you to snap your nodes in a grid layout. This allows developers to create rigid and organized network charts that improve visual clarity.

New Link Types in Net Chart
We have also added new link types to the Net Chart package. In addition to the default straight lines, you will also have the choice of curved and orthogonal links. Curved links do exactly just that – they curve, so when you have multiple links with similar paths, they don’t overlap with each other. Orthogonal links, however, bend at right angles along the way from source to the destination. You can see all three link types in the screenshot above.
Net Chart v2 Beta
We are currently developing the next version of Net Chart - v2. The beta is currently available to the developers on request, and you can contact our support team if you want to get your hands on the latest preview release. Here are the most important things coming with v2.
WebGL
We aim to have all our visuals run at a smooth 60fps framerate, and that’s something that we have achieved in most cases. However, due to the complex nature of graph charts, especially ones that feature thousands of nodes and/or links, the current framework does not allow for consistent performance when displaying intricate networks with tens of thousands of nodes.
Net Chart v2 introduces WebGL, which enables GPU-accelerated rendering. This is a crucial step towards performance, giving you the option to smoothly render detailed and sophisticated network graphs that feature thousands upon thousands of nodes.
GPU acceleration also paves the way for brand new interactivity features and visual special effects so your users can get completely immersed in the data exploration process. Speaking of immersion, the new rendering API also unlocks new future potential, and we are researching the use of VR and AR for data exploration.
It’s hard to understate the performance improvements that WebGL will bring, allowing you to handle even the most extreme data visualization challenges with ease. We’re excited to see what developers will do with Net Chart v2!
Lasso Selection
For this feature, we took inspiration from graphics editors, because the lasso tool is an intelligent idea that combines intuitiveness and ease-of-use with incredibly precise controls. With lasso selection, users will be able to select multiple nodes or node clusters.
Furthermore, you can save selections and customize the outline or fill color and opacity, and other options for each selection, and name the saved shapes. The default behavior for the lasso tool is simply clicking and starting a selection, but you’ll be able to assign any activity for this interaction.

Easy Migration
We’ve made the process of migrating your data from Net Chart v1 to v2 quick and effortless. The APIs are entirely compatible, which means that the brand-new version will work with your existing data with little to no changes. You’ll be able to enjoy all the benefits of v2 immediately after the release, without any hassle or frustration.
What’s Coming in Future?
In the webinar, our lead developer shared the team’s goals for the future. We always look forward to improving our JavaScript Charts and being on the cutting edge of data visualization, and the coming year has many exciting things in store for ZoomCharts users. Here’s a brief rundown.
The Future of Net Chart
The switch to WebGL and WebWorkers is just the beginning. It’s given our team so many new possibilities to push Net Chart v2 even further, and you can expect many new layout options, visual effects and brand-new features in future updates.
More Data Sorting and Aggregation Options
We’re looking at various new ways you can work with your data, including polynomial regression, automatic trendline plotting, and more.
Cloud Accelerator
We’re planning to implement cloud acceleration for complex graph layout computation acceleration, which will allow you to reduce server costs. This will also allow you to use both GPU and CPU for rendering at the same time.
New Chart Variations
We’re always on the lookout for brand new ways to visualize your data, and for 2023, we’re planning to introduce more data visualization options with ZoomCharts. We’ll start with scatterplot and bubble chart visualizations in NetChart, with more chart types on the way.

Conclusion
These are the features that are either already available in ZoomCharts JavaScript Charts or coming in the near future. Get the latest version of this SDK in the Downloads page. If you don’t have an account yet or need to extend your free trial, get in touch with as!

Want more info like this?
Subscribe to our newsletter and be the first to read our latest articles and expert data visualization tips!