May 20, 2015
The Billion Dollar o-Gram and Necessity to Visualize Data
People who are dealing with the data analysis and large data bases often struggle with making sensible reports and presentations that allow the target audience...


People who are dealing with the data analysis and large data bases often struggle with making sensible reports and presentations that allow the target audience...
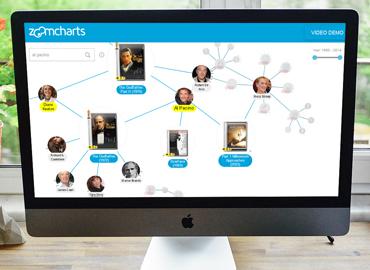
People who are dealing with the data analysis and large data bases often struggle with making sensible reports and presentations that allow the target audience to understand and visualize the whole picture of the processes, sources of data and their outcomes. ZoomCharts offers that solution through its interactive data visualization software.
In this TED-Ed video David McCandless explains why data visualization is important and how beautiful it is at the same time.

In this TED-Ed video David McCandless explains why data visualization is important and how beautiful it is at the same time.

Want more info like this?
Subscribe to our newsletter and be the first to read our latest articles and expert data visualization tips!

