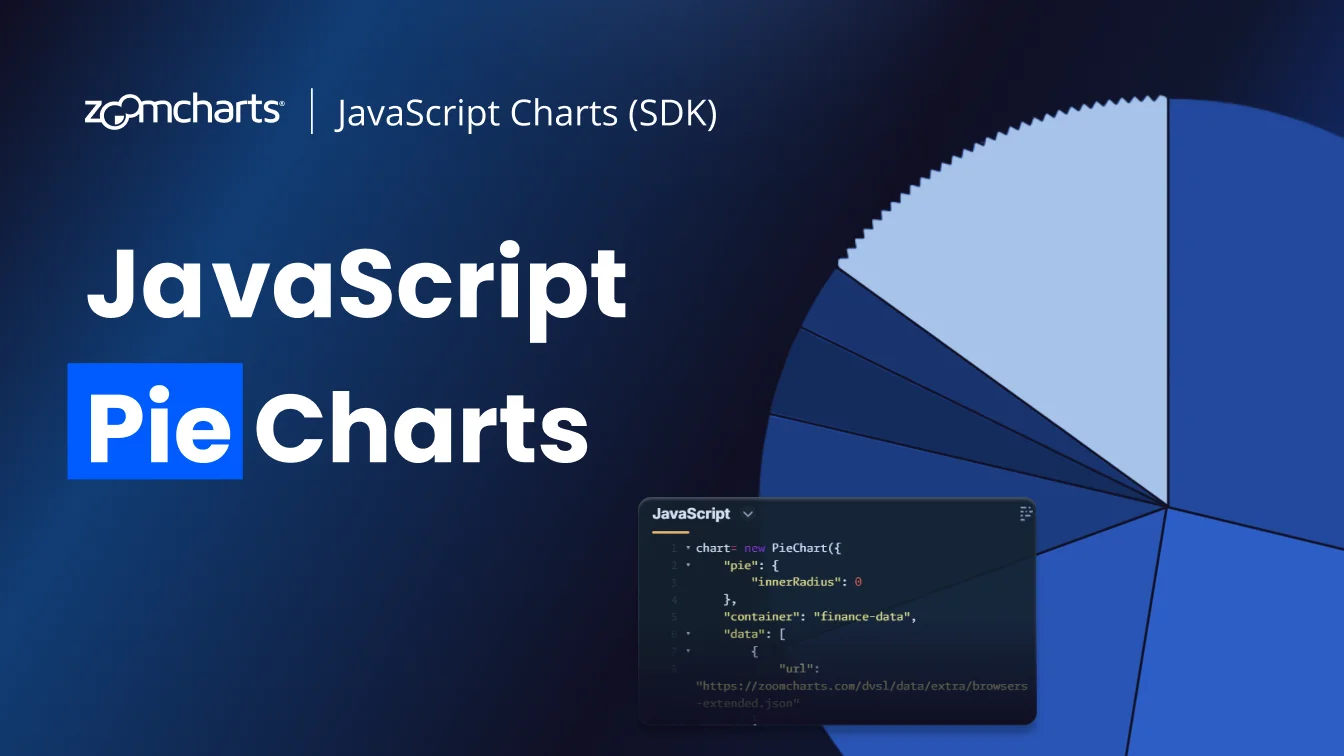
Jan 30, 2015

How to Use Time Chart - Custom Background Image

With ZoomCharts’ Custom Background Image feature, you can incorporate custom visuals into your graphs to enhance data presentation. Instead of a bland...

Title image
Title image

With ZoomCharts’ Custom Background Image feature, you can incorporate custom visuals into your graphs to enhance data presentation. Instead of a bland...

With ZoomCharts’ Custom Background Image feature, you can incorporate custom visuals into your graphs to enhance data presentation. Instead of a bland background, why not support your data with visuals that match your subject matter?

ZoomCharts’ Custom Background Image is an attractive feature currently being used to meet the advanced data visualization needs of various educational fields, including sciences and mathematics, such as anatomy, biochemistry, ecology, microbiology, nutrition, neuroscience, physiology, zoology, chemical engineering, geochemistry, molecular biology, geology, paleontology, physics, astronomy, algebra, computer science, geometry, logic, and statistics, and the arts such as, music, dance, theatre, film, animation, architecture, applied arts, photography, graphic design, interior design, and mixed media.

- Interactive chart that supports large amounts of data
- Chart background can be customized to suit your needs
- Data presentation is functional and visually appealing


Step 1 Customizable images allow you to style your chart background.

Step 2 Hover over time segments to display detailed information.

Step 3 Click on a time segment to expand data.

Step 4 Zoom in and out of the chart by swiping up or down with your mouse scroll pad, or by using the Zoom-out feature at the top left.

envelope icon

Want more info like this?

Subscribe to our newsletter and be the first to read our latest articles and expert data visualization tips!