Dec 17, 2014
ZoomCharts Releases New Software Version 1.3
December 16, 2014 — A world-renowned leader in interactive data visualization software, ZoomCharts has introduced improvements to its line of advanced data visualization tools with version 1.3.
ZoomCharts understands the dynamic needs of its clients, and having listened to client requests, it has ensured that these software improvements will make working with large databases and presenting large amounts of otherwise dense information easier than ever before.
ZoomCharts products have become faster, richer and have got a variety of new styling options!
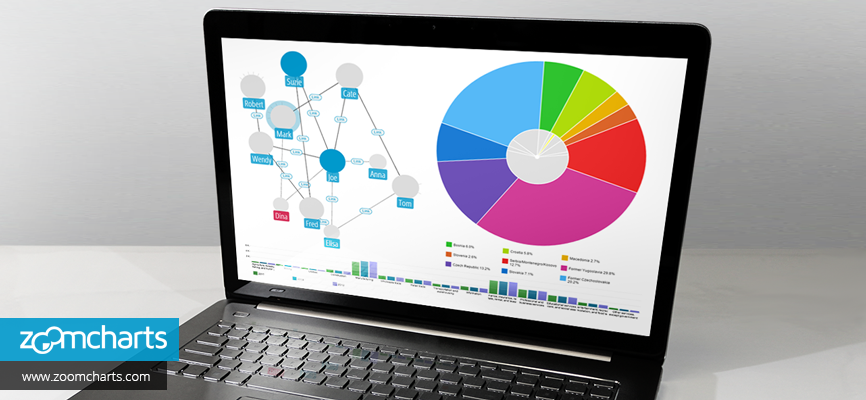
New ZoomCharts PieChart with clickable legend
ZoomCharts interactive PieChart now comes with a native, clickable legend.
Upgrades and new features to ZoomCharts’ visualization tool roster of Network Charts, Time Charts, Pie Charts, and Facet Charts include:
- Legends for all charts, which allows users to show/hide series of data
- An improved chart resizer bar with the option to lock chart aspect ratio
- Improved navigation options, including a new right click function across all platforms with a long press, and a new full screen toggle button
- A new chart clear history option that can clear all back history
- IE8 compatible rendering code, using ExplorerCanvas (trunk)
- Improved toolbar options, including custom toolbar items and toolbar positioning
- Multiple bug fixes
- Time chart and Facet chart upgrades, including value axis introduced valueAxis.valueFormatterFunction for custom label formatting
- Net chart upgrades, including new object classes for easier styling, and fixes for image load errors, eliminating an infinite loading symbol loop
- Pie chart upgrades, including a per-slice configurable label style using slice.labelStyle and slice.insideLabelStyle
New customizing features for NetChart and other charts
Style labels, links, nodes. Change colors, corner styles, shadows and glows. Use google web fonts and add icons... Hundreds of options!
TimeChart with dashed line
Our new TimeChart now perfectly fits for intuitive and out of the box visualization of data prediction.
For more information on the capabilities of ZoomCharts’ full range of advanced data visualization software, please visit https://zoomcharts.com.
About ZoomCharts
We are a VC-backed technology company specializing in advanced data visualization software. Our product is a cross-platform HTML5 SDK for creating dynamic interactive graphs optimized for touch-screen devices and web applications. Our tools enable intuitive and easy exploration of live databases. We help you visualize meaning in masses of content.

Want more info like this?
Subscribe to our newsletter and be the first to read our latest articles and expert data visualization tips!