Feb 09, 2016
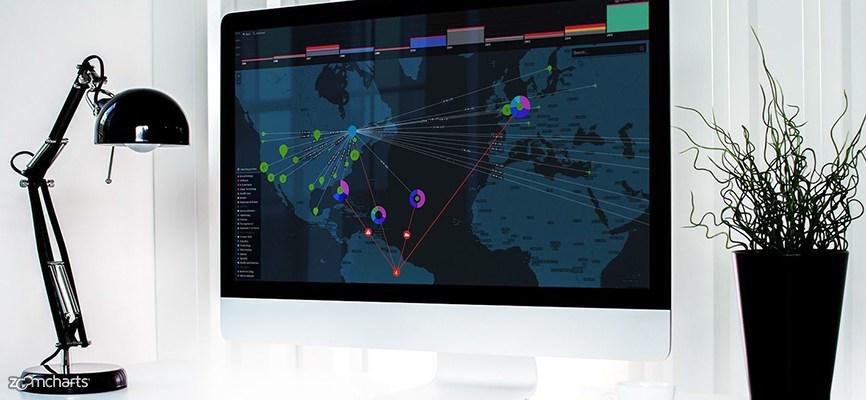
Data Visualization for Cyber Security
Big Data is no longer the hype that it used to be till a couple of years back. It’s a reality now – the data revolution is already here. The web has...
Big Data is no longer the hype that it used to be till a couple of years back. It’s a reality now – the data revolution is already here. The web has...
Big Data is no longer the hype that it used to be till a couple of years back. It’s a reality now – the data revolution is already here. The web has generated more data in past 2 years than the entire history of mankind!
Data is the new currency... and that’s the reason why Facebook has become a more valuable brand than likes of established brands viz. Walmart, BMW, Cisco & Disney! The rise of this data empire has led to a massive challenge of its safety from the prying eyes of bad actors.
“Every minute, we are seeing about half a million attack attempts that are happening in cyber space.”
- Derek Manky, Fortinet global security strategist
Institute of Risk Management (IRM), a UK based world’s leading industry body for risk management has made the following observation: Cyber Security, bribery, oil price and financial markets fluctuations are among chief concerns for businesses in 2016 and beyond.
With this unprecedented security crisis there exists a business opportunity in cyber security industry - the scale of which will be so gigantic that the world may have never witnessed before! Cybersecurity industry is predicted to multiply from $75 billion in 2015 to $170 billion by 2020.
So every established cyber security firm along with the shining new startups will battle fiercely to chase this billion-dollar opportunity.
Are you prepared to encash this big opportunity?
The market is crowded. What it takes to stand out in a crowded market?
Yes, we know you’ve employed the best available talents to write security software that can support your client 24x7x365 to monitor, maintain and review every possible log and can handle most of the network security challenges with ease. But that’s what possibly every other security firm is doing... isn’t it?
Now you may claim, hey! we’ve got charts & graphs too for many of our consoles. That’s indeed a right step in the right direction. Having said that, you must ask yourself:
Are your charts & graphs evolved enough to cater to the needs of your clients? Your specialization in security software is unquestioned but are you equally competent in creating awesome & effective charts which are blazing fast and support all modern devices?
Most real world crimes are committed in the cover of darkness and the criminals are generally masked. The cyber world bad actors follow the same modus operandi – they keep themselves invisible and cover- up their identity. In some of the refined attacks the bad guys are in fact able to successfully erase any footprint of their attack.
Most of the security tools rely on logs to detect any intrusion in the network. Logs are raw and dry. Dry because almost identical data is repeated over a million of times!
Logs are of great use in post attack forensic but of little use in preventing an attack. To prevent an attack your reaction time should be as short as possible and it’s indeed difficult to quickly read a pattern in the log data. Can the professional monitoring your logs quickly understand the various threat patterns along with the complex relationship between the network devices?
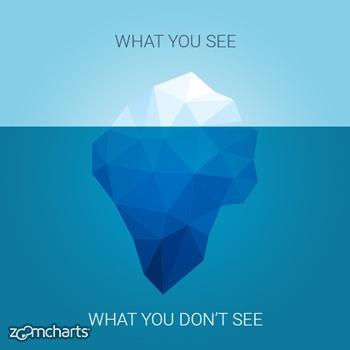 Within a limited amount of time, in most of the cases the log data may show a security professional, what we call, tip of the iceberg. The same data when processed, summarized and presented in a visually smart way can show you the whole iceberg – i.e. you can analyze the entire threat and prepare yourself for a swift response.
The integration of a visualization layer in your security solution is an affordable and smart move to make it more proactive and robust. With the help of data visualization, even a less experienced professional can efficiently monitor your client network – as humans are good at intuition situational awareness & predictive capabilities.
Most of the built-in visualization that comes with security solutions are either too basic (read charts from Y2K era) or too flamboyant (read graphics heavy charts that won’t load easily on a lower bandwidth connection or on a low memory device).
The lightweight ZoomCharts layer integrated with your existing solution can work wonders to enhance the user experience of your customers that essentially leads to quick security response. It supports:
There’s no end to creativity that you can bring with integrating ZoomCharts. You can use all the chart types provided by us in your solution. To get started we recommend the following charts in single or combination (in order of priority for security solutions):
ZoomCharts breakthrough technology is already being used by many notable companies viz. HP, Honeywell, Deloitte, DHL and Ericsson etc. This is what one of our customer, John Clelland, Managing Director of Infogov Ltd has to say about data visualization for cyber security:
When I saw ZoomCharts, I immediately thought - WOW! I could really come up with a fantastic presentation of something that is quite complicated and start to visualize it for the client.
Soon effective visual charts & graphs will become an integral part of every security solution. Integration of an advanced data visualization with your security solution will provide you the much needed edge to your product. Signup and stay ahead of the competition.
Data is the new currency... and that’s the reason why Facebook has become a more valuable brand than likes of established brands viz. Walmart, BMW, Cisco & Disney! The rise of this data empire has led to a massive challenge of its safety from the prying eyes of bad actors.
“Every minute, we are seeing about half a million attack attempts that are happening in cyber space.”
- Derek Manky, Fortinet global security strategist
Institute of Risk Management (IRM), a UK based world’s leading industry body for risk management has made the following observation: Cyber Security, bribery, oil price and financial markets fluctuations are among chief concerns for businesses in 2016 and beyond.
With Crisis Comes Opportunity
With this unprecedented security crisis there exists a business opportunity in cyber security industry - the scale of which will be so gigantic that the world may have never witnessed before! Cybersecurity industry is predicted to multiply from $75 billion in 2015 to $170 billion by 2020.
So every established cyber security firm along with the shining new startups will battle fiercely to chase this billion-dollar opportunity.
Are you prepared to encash this big opportunity?
Cyber Security Solution Provider: What’s Your USP?
The market is crowded. What it takes to stand out in a crowded market?
Yes, we know you’ve employed the best available talents to write security software that can support your client 24x7x365 to monitor, maintain and review every possible log and can handle most of the network security challenges with ease. But that’s what possibly every other security firm is doing... isn’t it?
Now you may claim, hey! we’ve got charts & graphs too for many of our consoles. That’s indeed a right step in the right direction. Having said that, you must ask yourself:
Are your charts & graphs evolved enough to cater to the needs of your clients? Your specialization in security software is unquestioned but are you equally competent in creating awesome & effective charts which are blazing fast and support all modern devices?
Visibility is the Enemy of Unknown Malicious Cyber Actor
Most real world crimes are committed in the cover of darkness and the criminals are generally masked. The cyber world bad actors follow the same modus operandi – they keep themselves invisible and cover- up their identity. In some of the refined attacks the bad guys are in fact able to successfully erase any footprint of their attack.
Most of the security tools rely on logs to detect any intrusion in the network. Logs are raw and dry. Dry because almost identical data is repeated over a million of times!
Logs are of great use in post attack forensic but of little use in preventing an attack. To prevent an attack your reaction time should be as short as possible and it’s indeed difficult to quickly read a pattern in the log data. Can the professional monitoring your logs quickly understand the various threat patterns along with the complex relationship between the network devices?
Text Data Shows only the Tip - Visualization Shows You the Real Picture... Rather Quickly!
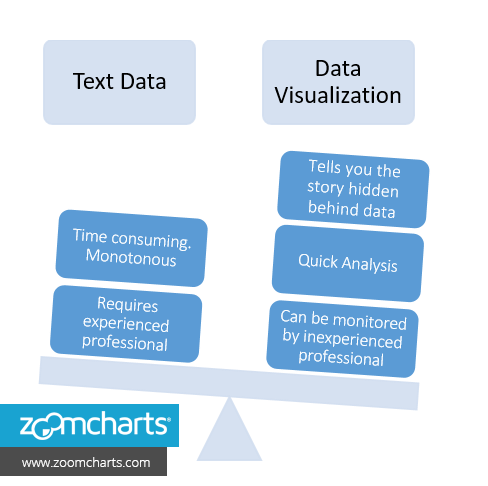
The integration of a visualization layer in your security solution is an affordable and smart move to make it more proactive and robust. With the help of data visualization, even a less experienced professional can efficiently monitor your client network – as humans are good at intuition situational awareness & predictive capabilities.
Text Data Vs. Data Visualization
Why you should Integrate ZoomCharts Data Visualization with Cyber Security Solution
Most of the built-in visualization that comes with security solutions are either too basic (read charts from Y2K era) or too flamboyant (read graphics heavy charts that won’t load easily on a lower bandwidth connection or on a low memory device).
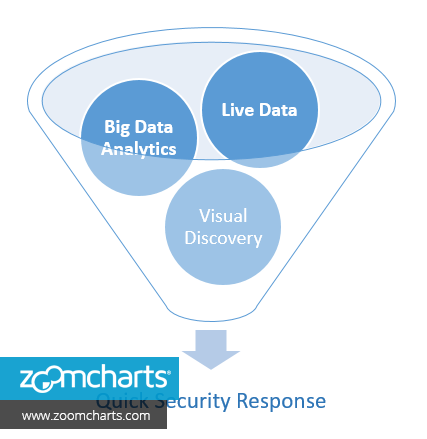
The lightweight ZoomCharts layer integrated with your existing solution can work wonders to enhance the user experience of your customers that essentially leads to quick security response. It supports:
- Live Data
Detect that an attack is happening as quick as possible. - Big Data Analytics
Designed with speed and scale in mind. A full-packet drill-down. - Visual Discovery
See & act. Spot suspicious spikes, patterns & paths instantly.
Which Type of ZoomCharts are Suitable for Security Solutions?
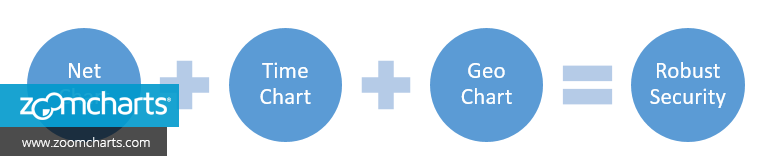
There’s no end to creativity that you can bring with integrating ZoomCharts. You can use all the chart types provided by us in your solution. To get started we recommend the following charts in single or combination (in order of priority for security solutions):
- Net Chart
- Time Chart
- Geo Chart
The ZoomCharts Experience
ZoomCharts breakthrough technology is already being used by many notable companies viz. HP, Honeywell, Deloitte, DHL and Ericsson etc. This is what one of our customer, John Clelland, Managing Director of Infogov Ltd has to say about data visualization for cyber security:
When I saw ZoomCharts, I immediately thought - WOW! I could really come up with a fantastic presentation of something that is quite complicated and start to visualize it for the client.
Bottom line
Soon effective visual charts & graphs will become an integral part of every security solution. Integration of an advanced data visualization with your security solution will provide you the much needed edge to your product. Signup and stay ahead of the competition.

Want more info like this?
Subscribe to our newsletter and be the first to read our latest articles and expert data visualization tips!