Jul 01, 2022
Microsoft Integrates ZoomCharts in Dynamics 365 Supply Chain Insights
We are excited to announce the collaboration between Microsoft’s latest product – Dynamics 365 Supply Chain Insights – and technologies provided by ZoomCharts – the Network and Map visuals.
We are excited to announce the collaboration between Microsoft’s latest product – Dynamics 365 Supply Chain Insights – and technologies provided by ZoomCharts – the Network and Map visuals.
Dynamics 365 Supply Chain Insights Reinforces Supply Chains
Microsoft’s Dynamics 365 Supply Chain Insights was built using the Power platform and attempts to tackle the problems associated with supply chain disruptions due to unprecedented risks and interferences.
By creating a digital twin of a supply chain, companies enable themselves to create a transparent supply chain system that can withstand, predict, and work around any radical changes in supply and demand, thus avoiding any disruptions that could potentially result in major economic losses.
ZoomCharts's Custom Visuals for Power BI in Action
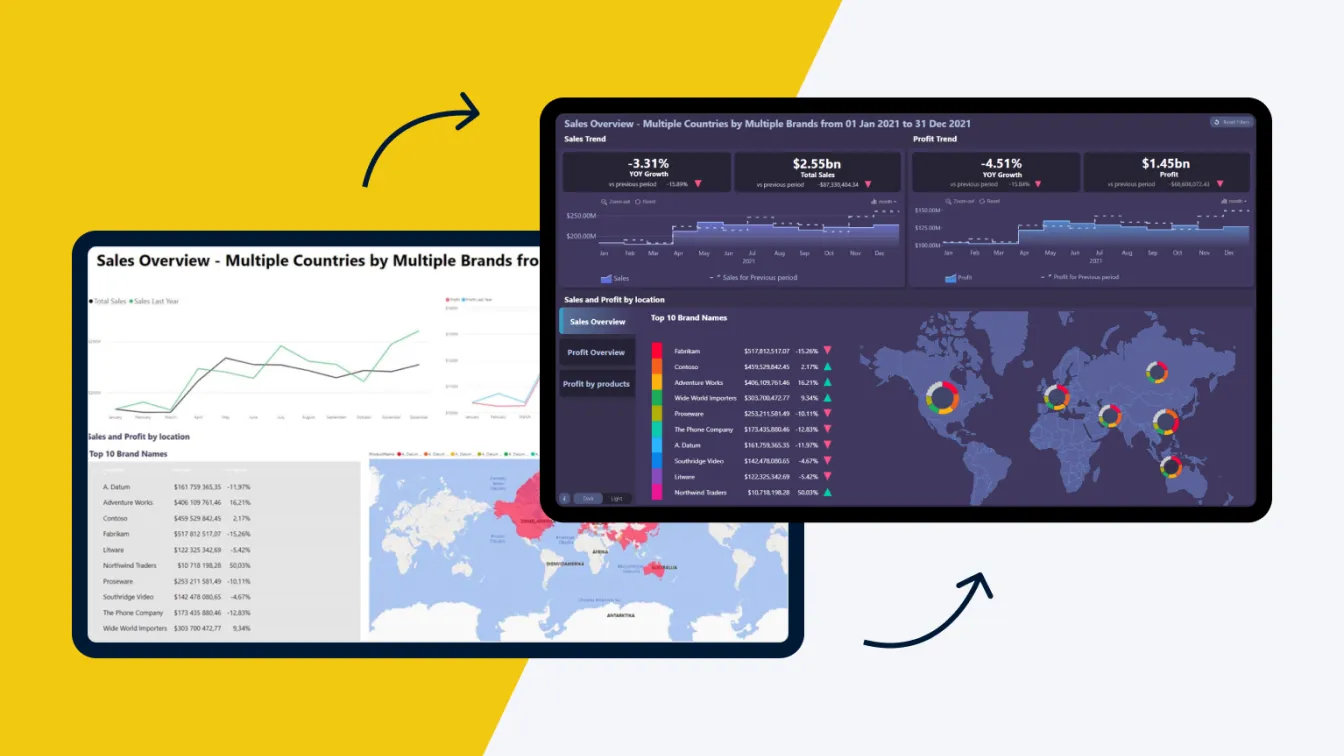
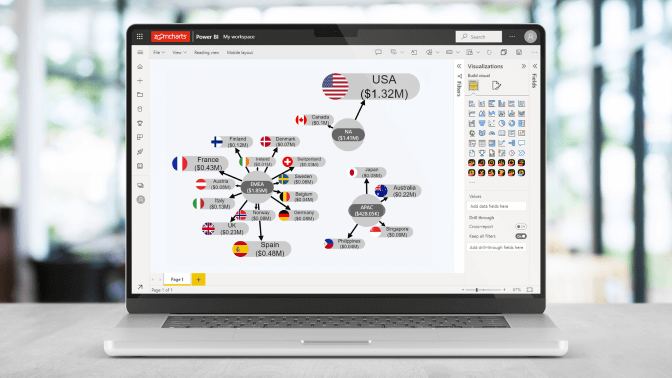
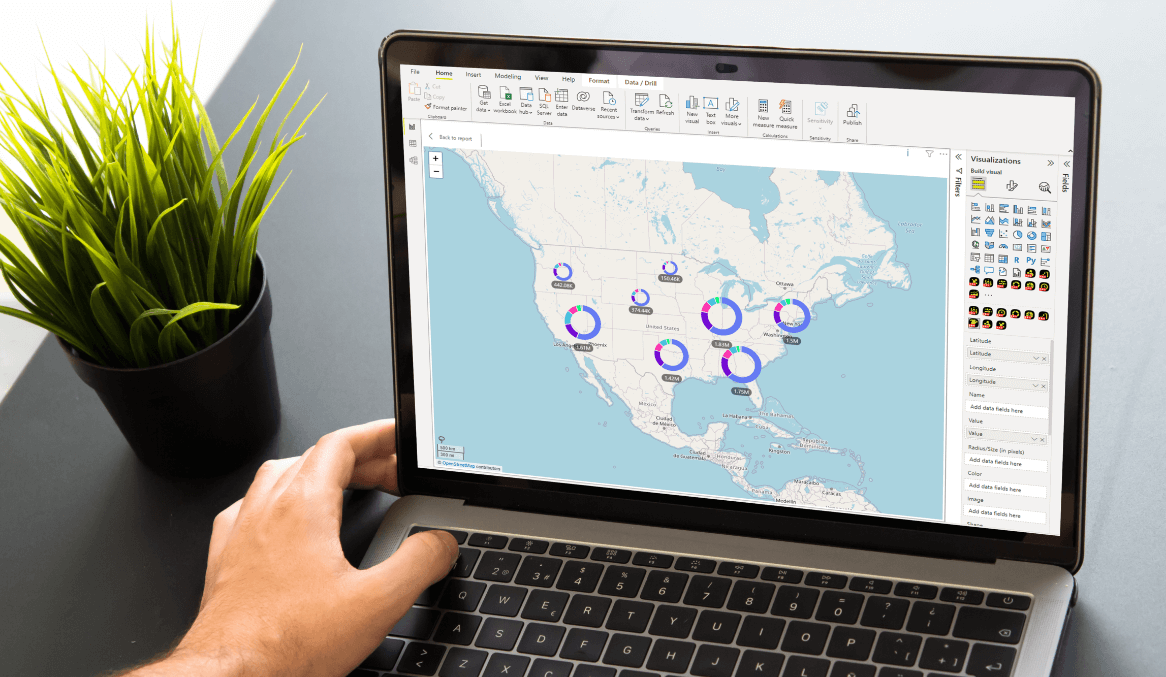
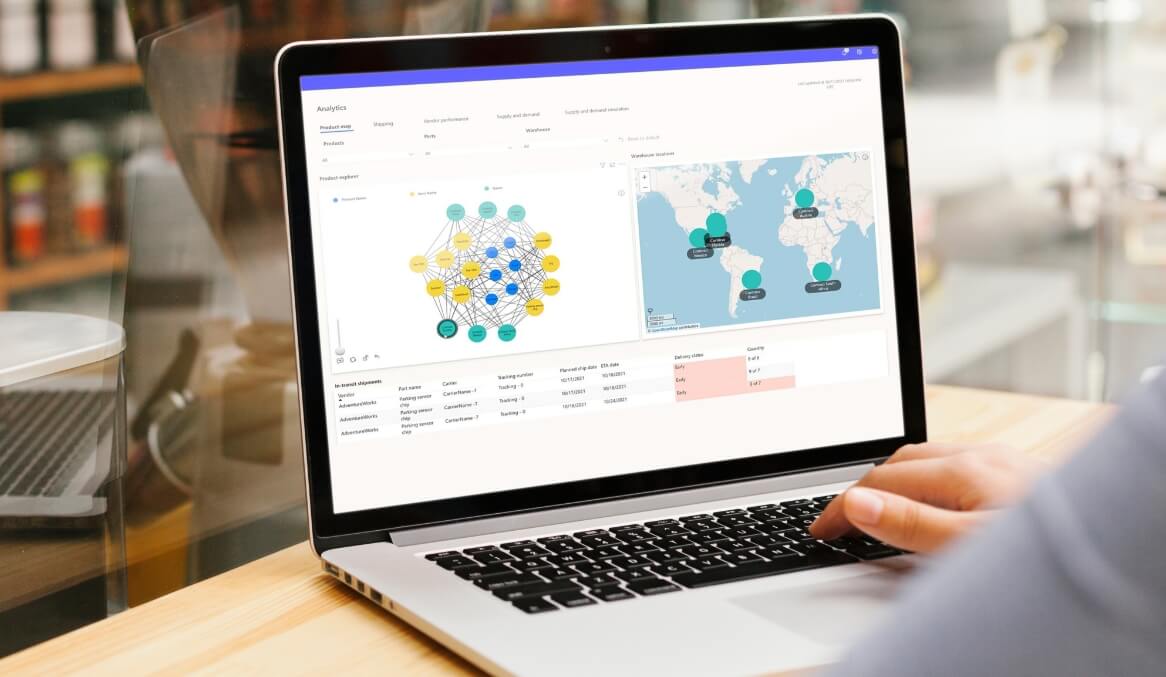
Microsoft incorporated the Network and Map visuals after reaching out to ZoomCharts to act as one of the select major tools within the Product Analytics Dashboard tab of Dynamics 365 Supply Chain Insights. These visuals work side by side, letting the user see what productions they have stationed in which areas, and help with shifting their production plans between manufacturers, thus avoiding any unnecessary losses.
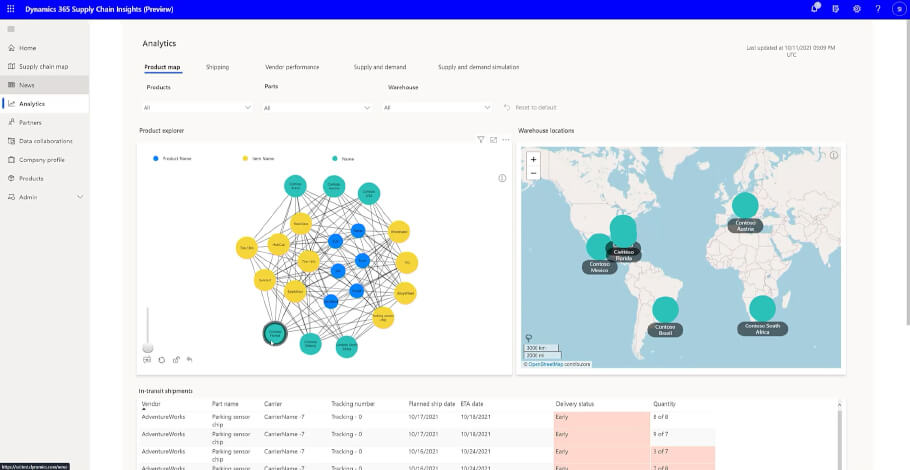
The Network and Map visuals work seamlessly in allowing the user to find solutions to production plan disturbances and help avoid any potential risks proposed by the provided news sources and third-party insurers.
The Next Step in Supply Chain Digitization
Using the insights gathered by the Product Analytics Dashboard, companies can take optimal action and collaborate with their suppliers, logistics partners, and internal stakeholders.
Dynamics 365 Supply Chain Insights combined with the technology of ZoomCharts is a notable step in the way of speeding up the necessary process of supply chain digitization.
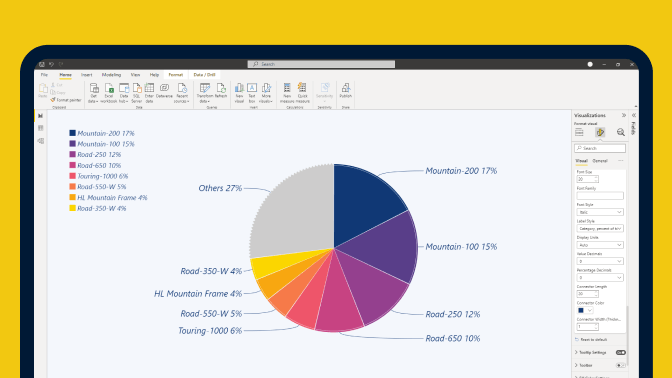
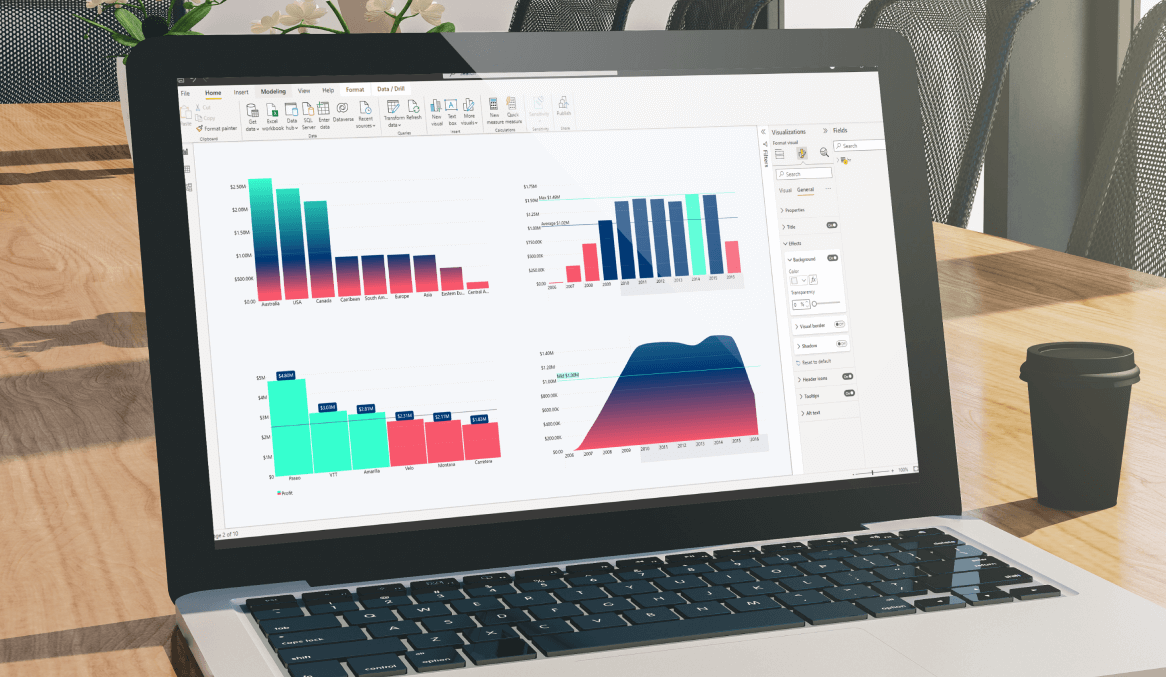
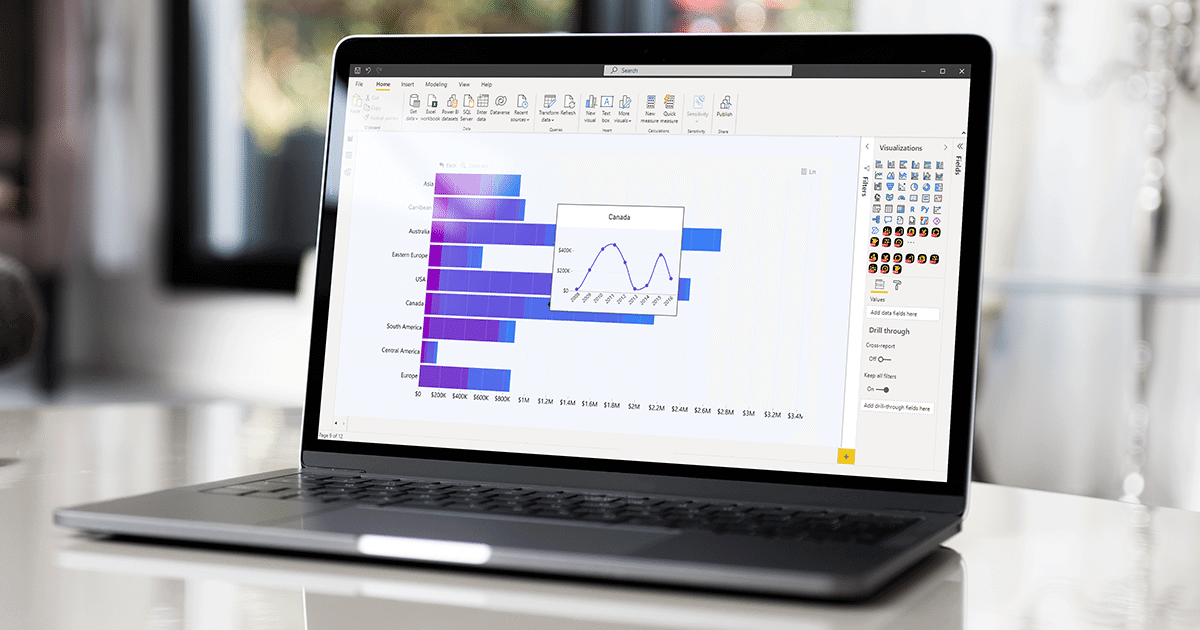
ZoomCharts Drill Down Visuals are known for their interactive drill downs, smooth animations, and rich customization options that help data analysts and enthusiasts achieve the full potential of their operations by unlocking key insights within their data.
Video excerpt from official launch:
See full video here!
Visit our product pages to evaluate Drill Down Map PRO and Drill Down Network PRO!

Want more info like this?
Subscribe to our newsletter and be the first to read our latest articles and expert data visualization tips!