logomain

ZoomCharts for Enterprise

Get a Quote Let's get started

after

Eliminate the learning curve in understanding Power BI

Make data driven decisions intuitively, quickly and with joy

after

Drill down through massive amounts of data without getting lost in the layers

Drill down massive amounts of data (large datasets) without getting lost in the layers.

ZoomCharts Drill Down Visuals

See what are the main features for each visual

Drill Down Donut PRO

Drill Down Donut PRO

Drill Down Combo Pro

Drill Down Combo Pro

Drill Down Timeseries Pro

Drill Down Timeseries Pro

Drill Down Network Pro

Drill Down Network Pro

Drill Down Graph Pro

Drill Down Graph Pro

Drill Down Waterfall Pro

Drill Down Waterfall Pro

Drill Down Combo Bar Pro

Drill Down Combo Bar Pro

Drill Down Pie Pro

Drill Down Pie Pro

Drill Down Map Pro

Drill Down Map Pro

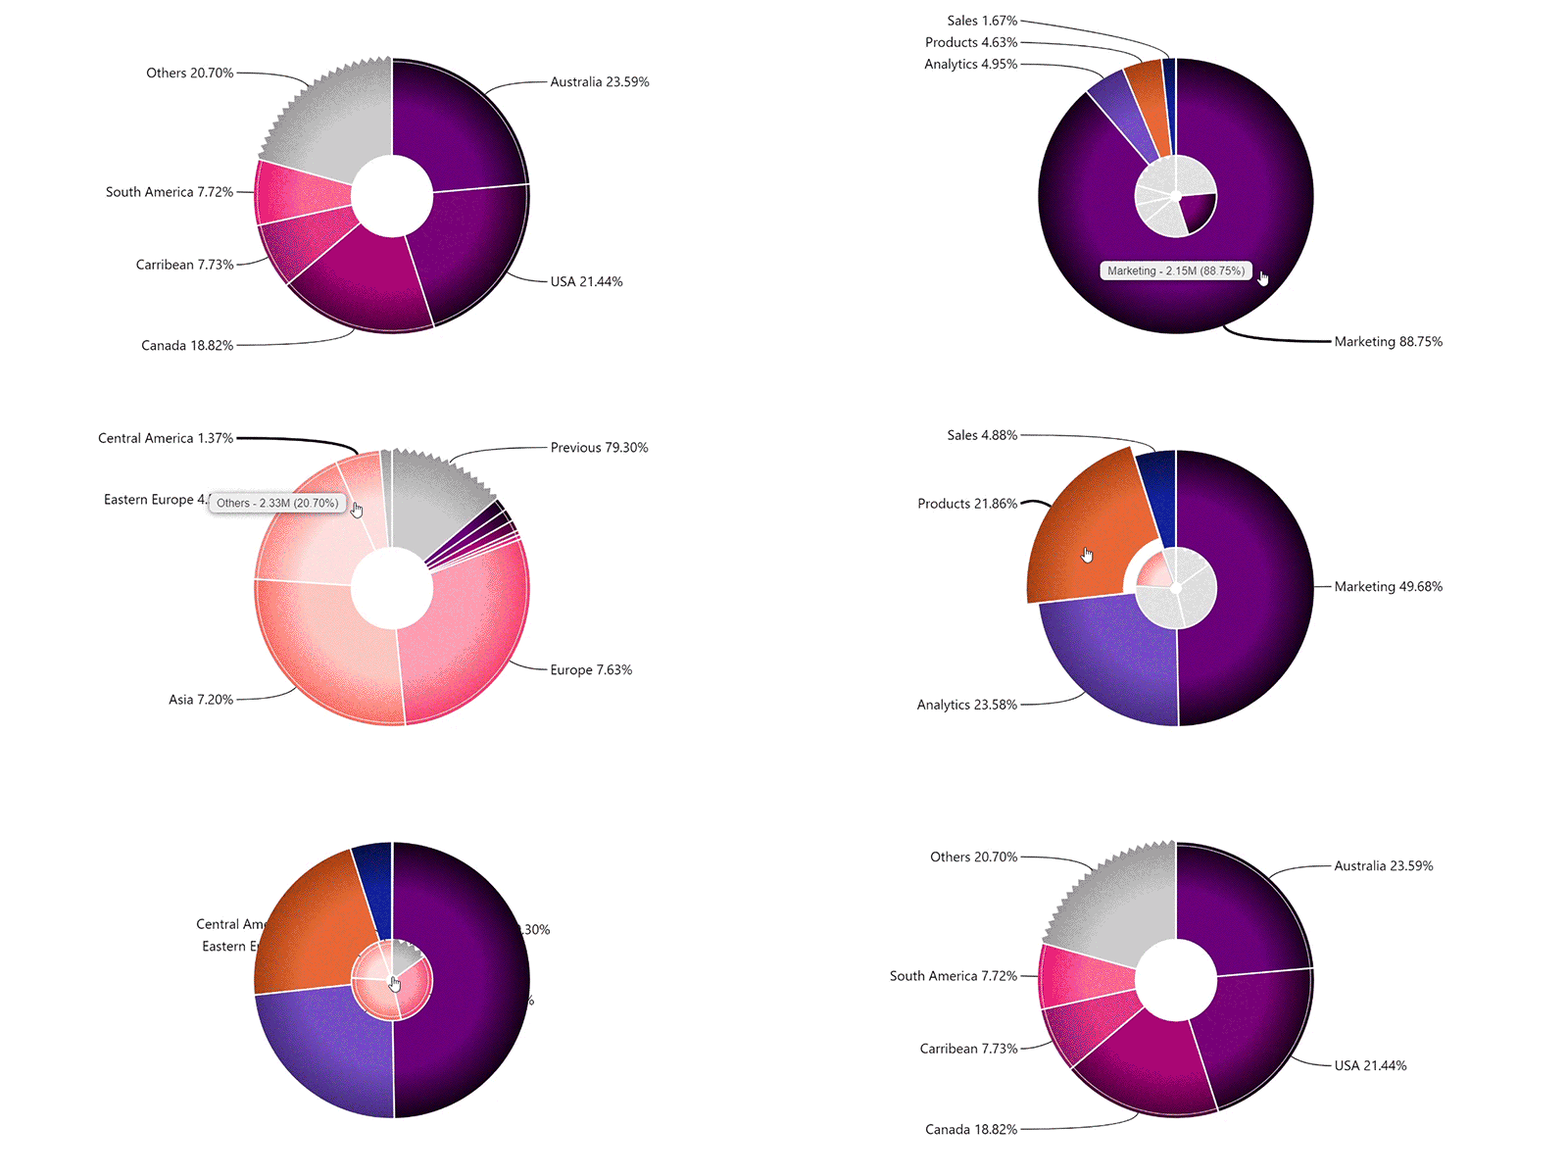
Enjoy interactive drill downs, user friendly navigation, and rich customization options. Select between multiple chart types and control the number of visible slices.

Visualize and explore category-based data using interactive drill down and scrolling features. Combine bars, lines, and areas. Use multiple stacking and clustering options. Customize each series individually.

Explore time-based data down to each millisecond with interactive drill downs and scrolling. Combine bars, lines, and areas. Use multiple stacking and clustering options. Customize each series individually.

Create beautiful and easy to explore networks from category-based data. Charts automatically detect relations among categories, force feedback layout prevents nodes from overlapping, and rich customization options allow control over each category's look.

Build networks and explore relations within them using the first true graph visual for Power BI. Enjoy exceptional navigation, rich information display, and endless customization options.

Visualize totals, subtotals, and column sequences straight from the dataset and use rich formatting options to control the look of the chart. Interactive zooming and drill downs will ensure that data is easy and quick to explore.

Combine bars, lines, and areas. Use multiple stacking and clustering options and customize each series individually. Interactive zooming and drilldowns will ensure that data is easy and quick to explore.

Take the traditional pie chart to a whole new level with touch driven interactions, adjustable slices, and rich customization options. Explore up to 9 data levels.

Visualize location data on maps that are easy and intuitive to explore on any device. Explore data by country, city or use the lasso tool to create storable filters for custom regions. Add pie charts on top of the map to visualize clusters of data. Pick the tile server of your choice and use rich formatting options to style data.

checkmark

Adjustable “Others” and “Previous” groupings

checkmark

Inner / reference donuts

checkmark

End user friendly interactions

donut

ZoomCharts Drill Down Visuals licensing models

licensing
User-based

licensing model

For small companies and companies with a predictable user count - up to 500 users.

licensing
Capacity-based

licensing model

For larger companies or projects that do not wish to manage individual users.

licensing
Enterprise-based

licensing model

For large and international organizations that wish to use ZoomCharts at all levels & capacities without limit.

Why our customers love us

Trusted by more than 10’000 organizations worldwide

customer

"In choosing ZoomCharts, I was impressed by the amount of customization options. Looking at some of the visuals supplied by Microsoft, you start to feel pretty boxed-in on customization options, colors, and labels. And if you're trying to tell a visual story, that customization is key. So that's what led us to ZoomCharts - just being able to engage with ZoomCharts to make the customizations we were looking for." 

Scott Mihlon

Decision Analyst, Chevron
customer

“Yesterday I demonstrated our Data Platform and finished with Power BI Desktop. As usual, I tested some customized visuals, and this time they were from Drill Down Visuals. It was a first for me to add “commercial” visuals in my demo for customers. And they really loved it, even if I mentioned that it’s not a free visual.”

Franck Mercier

Technical Evangelist and Technical Solution Professional, Microsoft Canada
customer

The ZoomCharts library is built in such a way that it is very easy for the developer to manipulate the look and feel of charts.

Integrated Digital Systems

customer

When I saw ZoomCharts, I immediately thought - WOW! I can come up with a fantastic presentation of something that is quite complicated and easily visualize it for the client.

John Clelland

Managing Director of Infogov Ltd
How it works?
1
Request a Quote
Request a Quote

Fill in your details and describe your use case

2
Receive Individual Offer

Get a personalized offer that fits your organization's needs

3
Create Better Reports

Have fun with creating more intuitive reports

Let's get started
Request a quote