Eliminate the learning curve in understanding Power BI
Make data driven decisions intuitively, quickly and with joy

Drill down through massive amounts of data without getting lost in the layers
Drill down massive amounts of data (large datasets) without getting lost in the layers.


See what are the main features for each visual

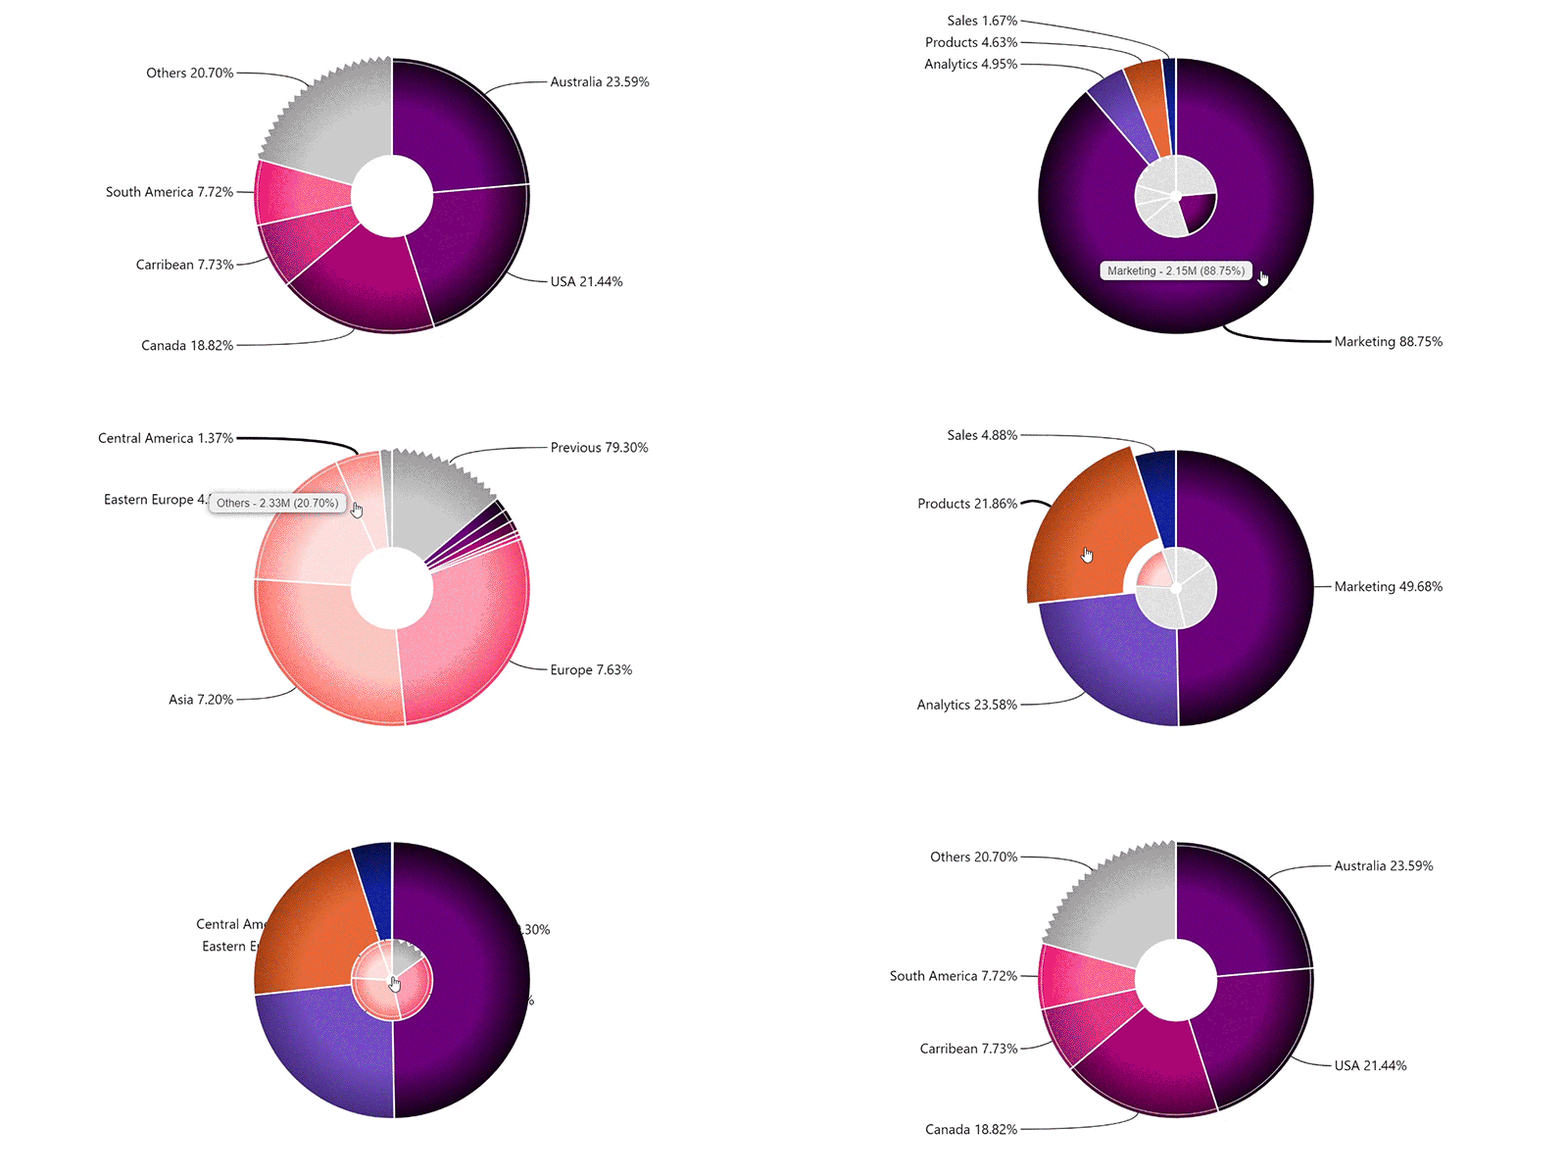
Adjustable “Others” and “Previous” groupings

Inner / reference donuts

End user friendly interactions


licensing model
For small companies and companies with a predictable user count - up to 500 users.

licensing model
For larger companies or projects that do not wish to manage individual users.

licensing model
For large and international organizations that wish to use ZoomCharts at all levels & capacities without limit.
Trusted by more than 10’000 organizations worldwide

"In choosing ZoomCharts, I was impressed by the amount of customization options. Looking at some of the visuals supplied by Microsoft, you start to feel pretty boxed-in on customization options, colors, and labels. And if you're trying to tell a visual story, that customization is key. So that's what led us to ZoomCharts - just being able to engage with ZoomCharts to make the customizations we were looking for."

“Yesterday I demonstrated our Data Platform and finished with Power BI Desktop. As usual, I tested some customized visuals, and this time they were from Drill Down Visuals. It was a first for me to add “commercial” visuals in my demo for customers. And they really loved it, even if I mentioned that it’s not a free visual.”
Fill in your details and describe your use case
Get a personalized offer that fits your organization's needs
Have fun with creating more intuitive reports