ZoomCharts Documentation
Switch to Version 2.0 (BETA)
Time Axis
Time Chart is all about time and making easy to navigate it. There are few concepts we use to talk clearly about time in the chart:
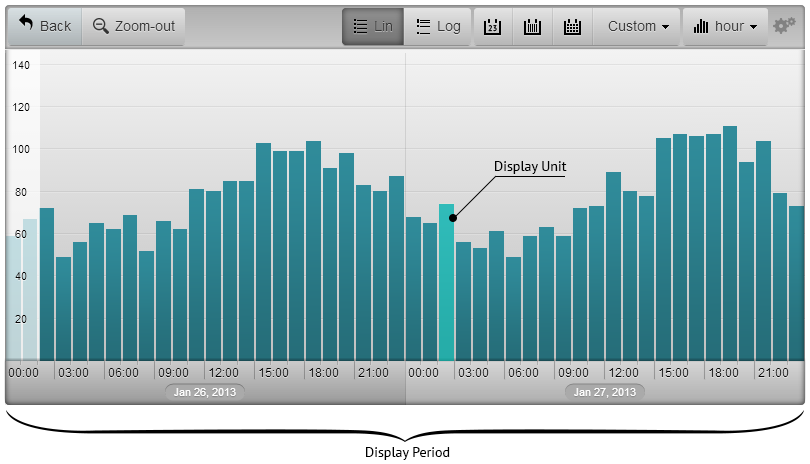
- display period - the currently visible time period in the chart.
- display unit - every data point on the chart shows data aggregated over this time unit.
Automatic period and unit
When navigating data Time Chart automatically adjusts display unit and period. Settings.interaction.snapMode setting determines how display period is chosen.
Possible display period and unit values are defined in settings.area.displayPeriods and settings.area.displayUnits.
Specifying moment in time
All absolute moments in time in Time Chart are specified as Unix timestamp in milliseconds. UTC is used as time zone for all data.
Specifying a time unit
Time chart uses an intuitive syntax to specify time units as strings, for example "1 day".
The string consists of two space separated parts: "<number of units> <unit name>".
The number of units can be skipped and is defaulted to 1, so "day" is the same as "1 day".
Time Chart understands the following unit names:
- year:
"y","year","years" - month:
"M","month","months" - week:
"w","week","weeks" - day:
"d","day","days" - hour:
"h","hour","hours" - minute:
"m","minute","minutes" - second:
"s","second","seconds" - millisecond:
"ms","millisecond","milliseconds"
Unit names are case sensitive.
Specifying display period
Display period is specified in two parts: period and anchor. This allows to flexibly choose display period depending on available data.
Initial display period is specified with settings.area.initialDisplayPeriod and settings.area.initialDisplayAnchor.
You can change display period later by calling chart.setDisplayPeriod(period, anchor, animate).
Period can be one of:
"timestamp > timestamp"- show time range specified by two timestamps. Anchor is not used in this case."1 week","10 seconds",... - specify time period to show."max"- show all data, see Data on how data bounds is determined.
Anchor is used to position the period relative to data:
"now"- set end of the period to current time, beginning is calculated according to intialDisplayPeriod."newestData"- set end of the period to newest data, beginning is calculated according to intialDisplayPeriod."oldestData"- set beginning of the period to oldest data, end is calculated according to intialDisplayPeriod.timestamp- set period end time in milliseconds.
Formatting
Time Chart uses Moment.js library for time related text formatting.