The World's most explorable JavaScript Charts

Easily integrate content drilldown and multi-touch enabled big data visualizations into your web projects

system_update_altStart now
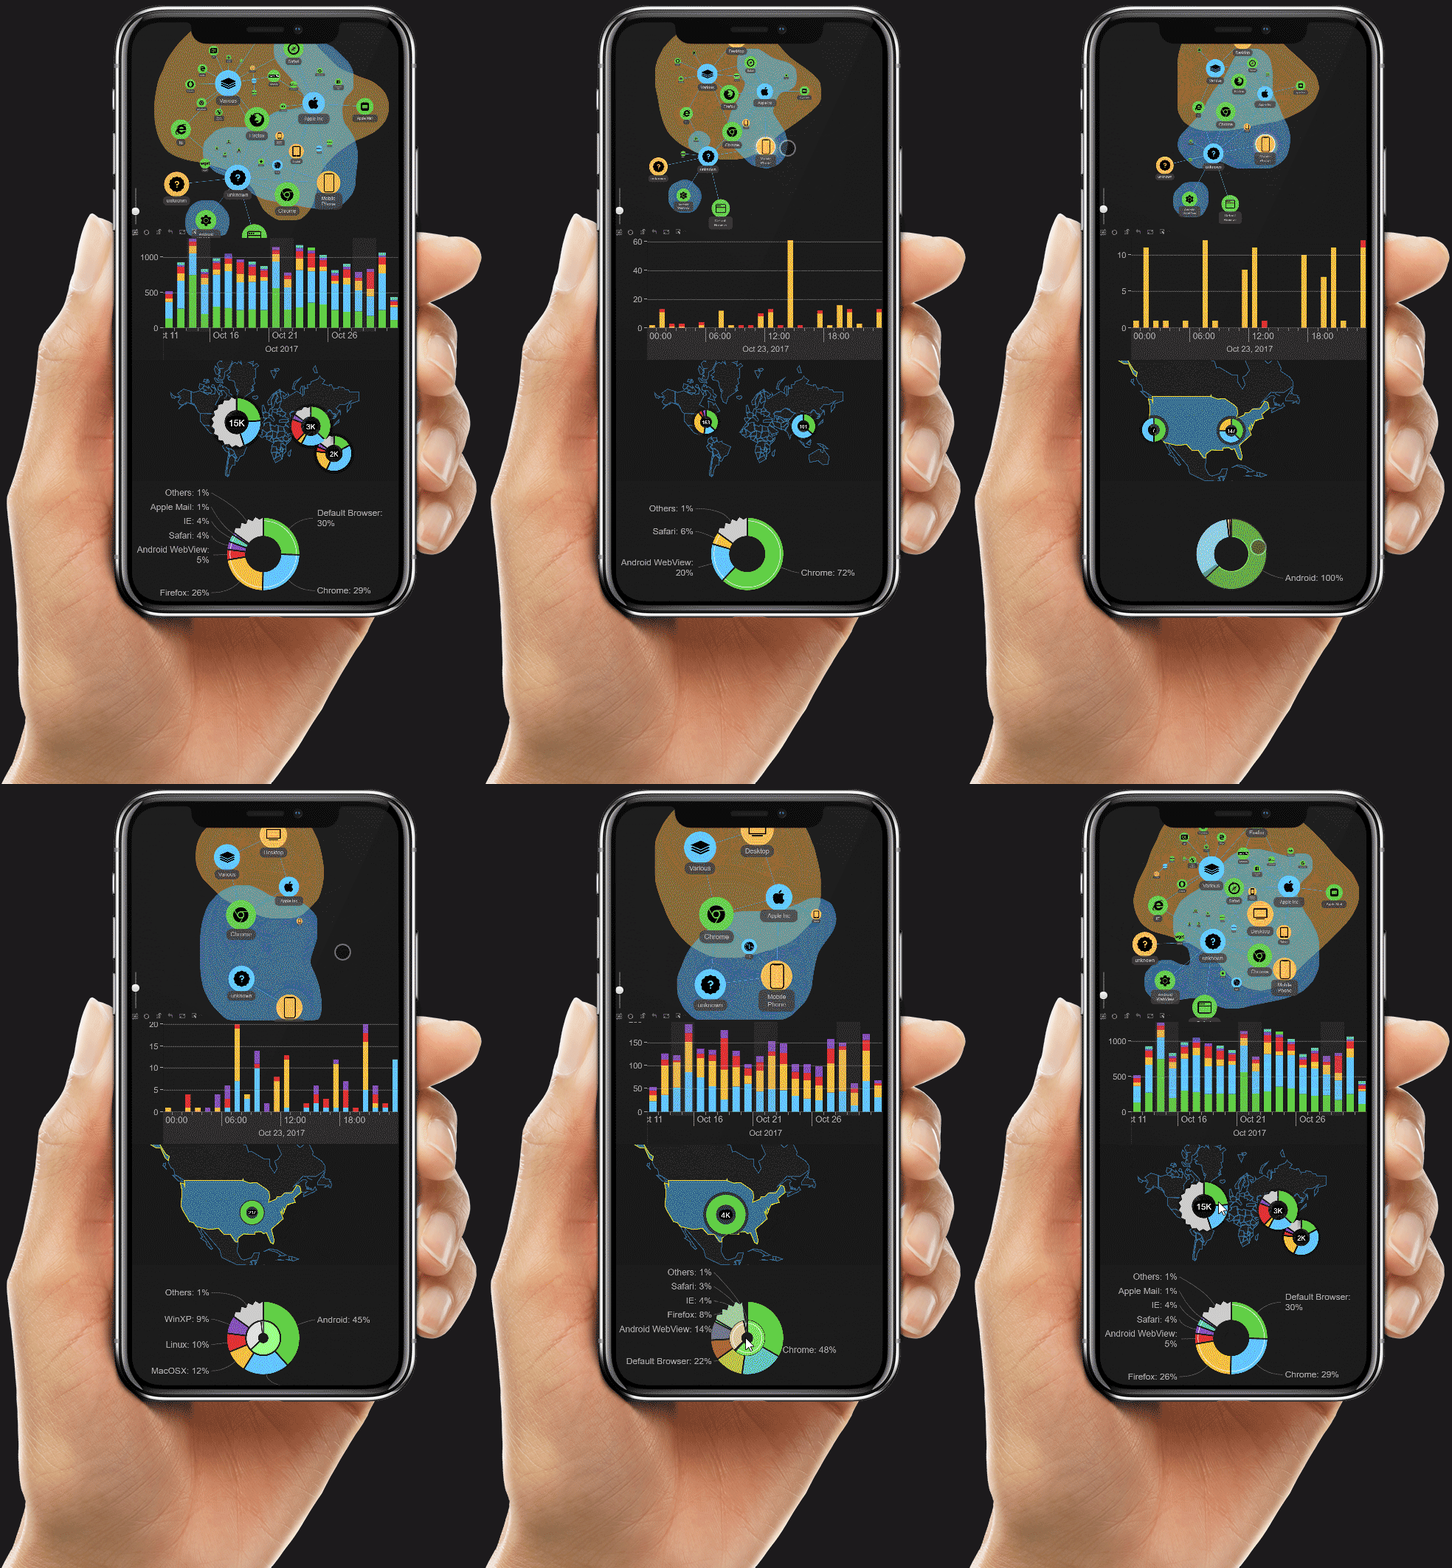
ZoomCharts interactive JavaScript charts demo

How it works

Create complex and interactive data visualizations with minimal input and development time by using a ready-to-go javascript charts library.

storage
Choose your data source

Use preloaded data or integrate with any SQL/NoSQL databases.

view_module
Select your chart type

Choose from hundreds of JavaScript chart types and customize them as desired.

code
Get the code

Add ZoomCharts JavaScript charts library to your web project and integrate the interactive charts with a few lines of JavaScript code.

fingerprint
Immersive interaction

Charts are deeply interactive - use gestures and clicks to explore data through the charts using drill-down and filtration - wow-factor guaranteed.

Fast, easy and impressive JavaScript charts

Integrate javascript charts with stunning drill-down functionality at breakneck speeds, sure to leave your team, leaders, and visitors impressed.

code

Big charts with little code

Simply integrate with a few lines of code to your website to implement the charts of your choice.

alarm_on

Incredible functionality without having to invest the time

Get complex content drilldown and filtering capabilities without putting in the time it takes to develop it from scratch.

dashboard

Provide multiple data sources

Don't worry about data coming from different sources - you can mix multiple data sources in the same chart if necessary.

view_carousel

Smart data aggregation

ZoomCharts aggregates data for you. Provide data per day, and ZoomCharts will be able to provide automatic aggregations of data on weeks, months, etc.

bookmark_border

Patent pending

Most iconic features of ZoomCharts, such as charts-on-charts technology and others, are patent pending.

thumb_up

Top level end product

Stand out from your competition with frontier data visualization layer that makes impression.

Dive deep into data exploration

Jaw-dropping ways to visualize your data - here are the different interaction possibilities and functionality of ZoomCharts JavaScript charts.

Content drill-down and drill-up

Dive deep into specific data point or get a bigger picture. Travel through different data levels by physically interacting with the charts by zooming in or zooming out.

Data filtering

Select one or several data points to view specific data. Click on one point to view one data set, or shift+click to select multiple at a time.

Cross-chart connectivity

Display multiple charts based on one data set. All connected charts respond to data filtration made in any one of them, and therefore constantly reflect filtered data in each chart.

Use multiple gestures to navigate

Use gestures on touch screen devices or your mouse to navigate - pinch to zoom, drag your finger or mouse to expand the timeline, tap or click to view one data point, and more. View demo.

Handles big data

ZoomCharts is built to work with and visualize large amounts of data. Stored elsewhere, the necessary data is pulled up as it's requested by the viewer, based on their navigation.

The most stunning way to show off your data

The thing about ZoomCharts is...you don't know what you've been missing out on until you give it a try. No one is left unimpressed after clicking through a ZoomCharts-powered data visualization.

For developers, by developers

Functionality is thought through to be the easiest to use. Details that make it a pleasure to work with:

settings

Powerful API

Integrate with external services and other UI components for rich and unique data manipulation and presentation

verified_user

Avoid configuration errors

Become aware of errors with built in property validation

aspect_ratio

Responsive from the get-go

Works on mobile devices and desktop.

view_carousel

Wide compatibility

Works on any device, any OS, compatible with most frameworks (jQuery, Angular, React etc.).

extension

Incremental loading

Ready for big data. Incremental loading + smart cache create a stable and quick solution.

description

Documentation

View extensive documentation for maximum knowledge transfer.

Who uses ZoomCharts

Anyone with a significant amount of data can use ZoomCharts to offer an immersive way to explore and understand it.

Businesses

ZoomCharts can be used to create unique business intelligence platforms based on business metrics and analytics.

Software

Integrate javascript charts libraries to software projects regardless of data source of framework to demonstrate data.

Mobile apps

Supported by Android and iOS, and compatible with most UI frameworks (jQuery, Angular, React etc.)

More than 300 companies from 50+ countries and 40+ industries are already enjoying their data using ZoomCharts

What people are saying about ZoomCharts

From Saas and mobile projects to internal business intelligence dashboards, ZoomCharts-enabled solutions are impressing across the board.

Cyber Security

John Clelland

Managing Director of Proteus-Cyber

When I saw ZoomCharts, I immediately thought - WOW! I could really come up with a fantastic presentation of something that is quite complicated and start to visualize it for the client.

Banking

Janis Cunskis

Project Portfolio Director of D8 Corporation

What our customers like about ZoomCharts is that it allows to get to the information that they are searching for in a very playfull manner.

Start now

Start now to explore the possibilities of the Zoomcharts JavaScript charts library.

system_update_altStart now

Get in touch

Have any questions? Hit the chat button in the corner - we'd love to talk!

//