Feel free to leave your vote:
0
Share template with others
Summary
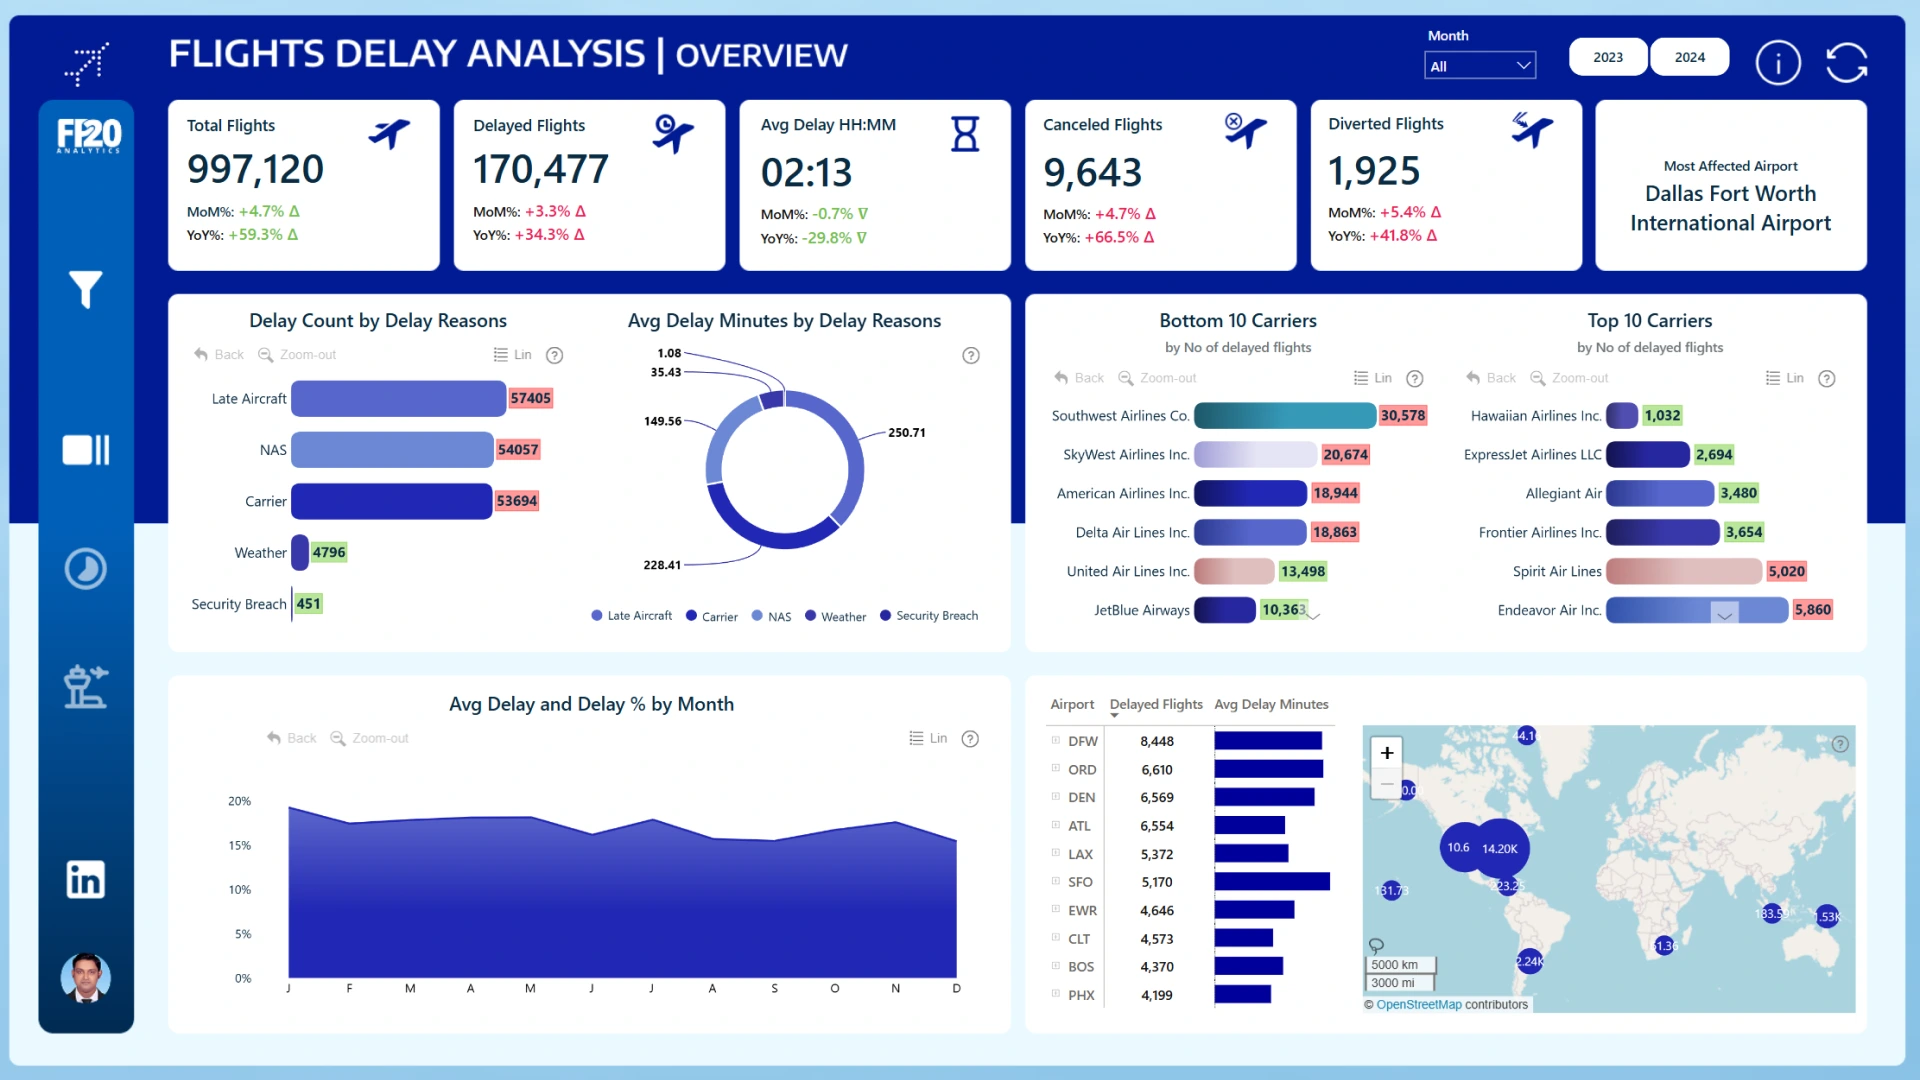
Report submitted for the FP20 Analytics ZoomCharts Challenge, January 2025. The report was built using the Airline Delays Dataset and includes ZoomCharts custom Drill Down PRO visuals for Power BI.
Author's description:
This Power BI report provides an in-depth analysis of key performance metrics, trends, and insights, enabling data-driven decision-making. It includes interactive visualizations, comparisons, and dynamic filters to enhance user experience and make complex data easily interpretable.
ZoomCharts visuals used
Mobile view allows you to interact with the report. To Download the template please switch to desktop view.