Jan 02, 2020
You asked, we delivered. Introducing Drill Down Combo Bar PRO.
Drill Down Combo Bar PRO is out and ready to spruce up your reports! Visual goes beyond traditional bar chart experience with multiple chart types (column,...
Drill Down Combo Bar PRO is out and ready to spruce up your reports! Visual goes beyond traditional bar chart experience with multiple chart types (column,...
Drill Down Combo Bar PRO is out and ready to spruce up your reports! Visual goes beyond traditional bar chart experience with multiple chart types (column, line and area), various stacking and clustering options, and static and dynamic thresholds. Combined with interactive drilldowns and rich customization options, combo bar allows you to build truly unique, engaging and, most importantly, user friendly reports.
Take a look at video for a quick overview.
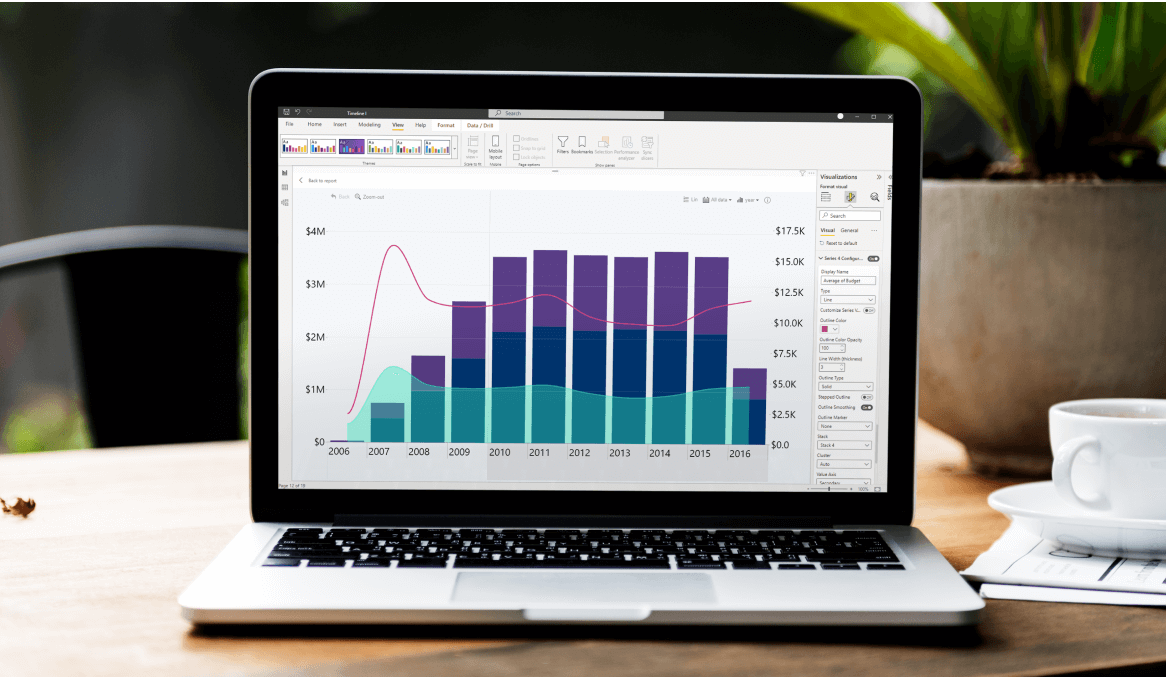
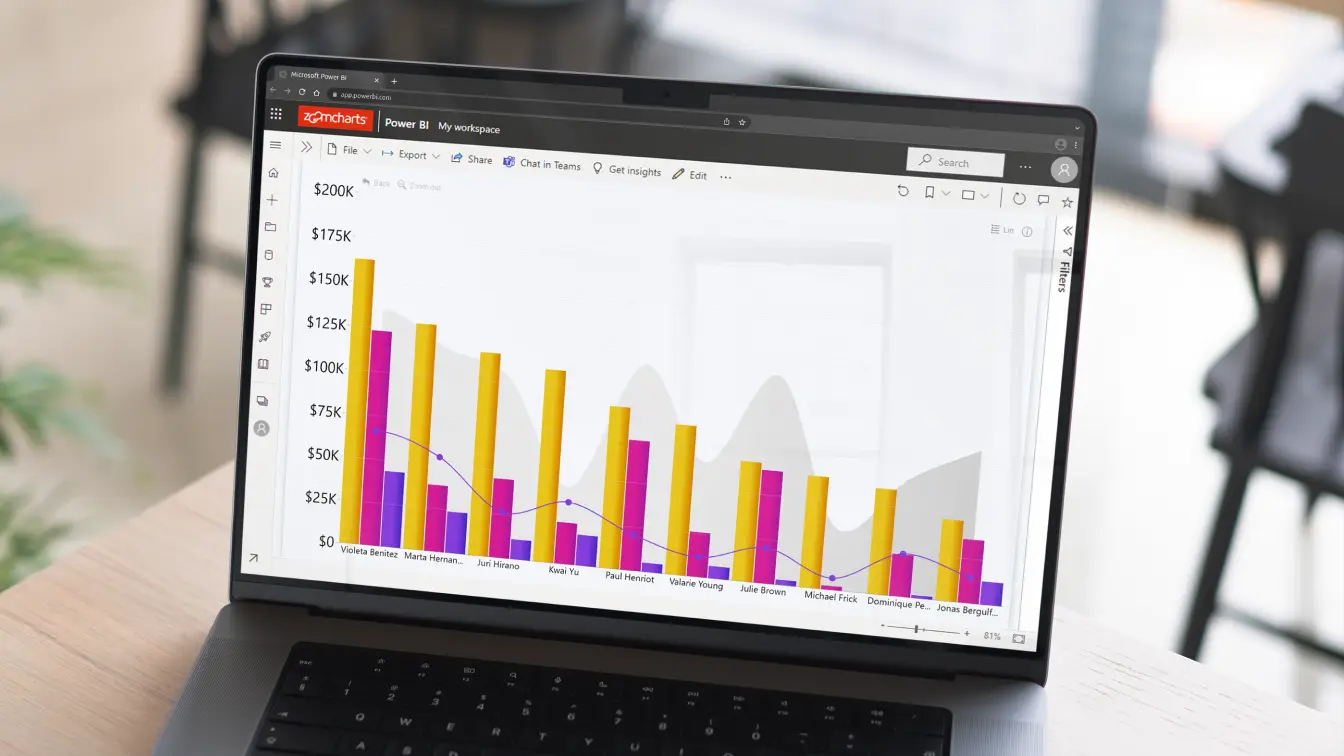
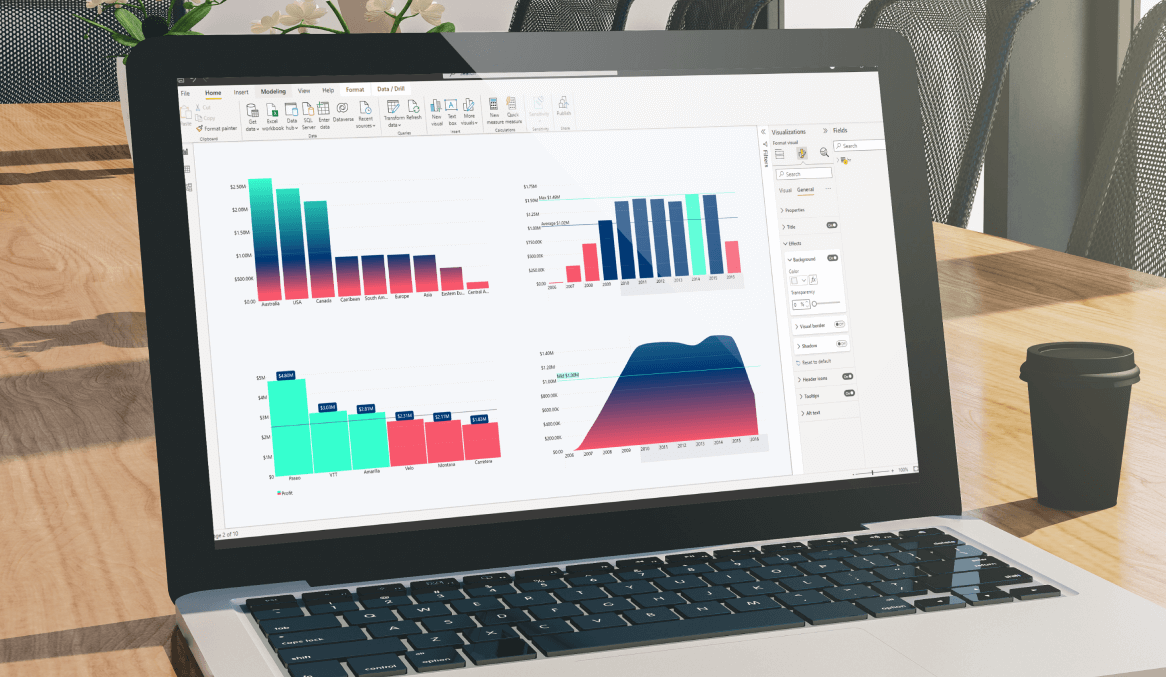
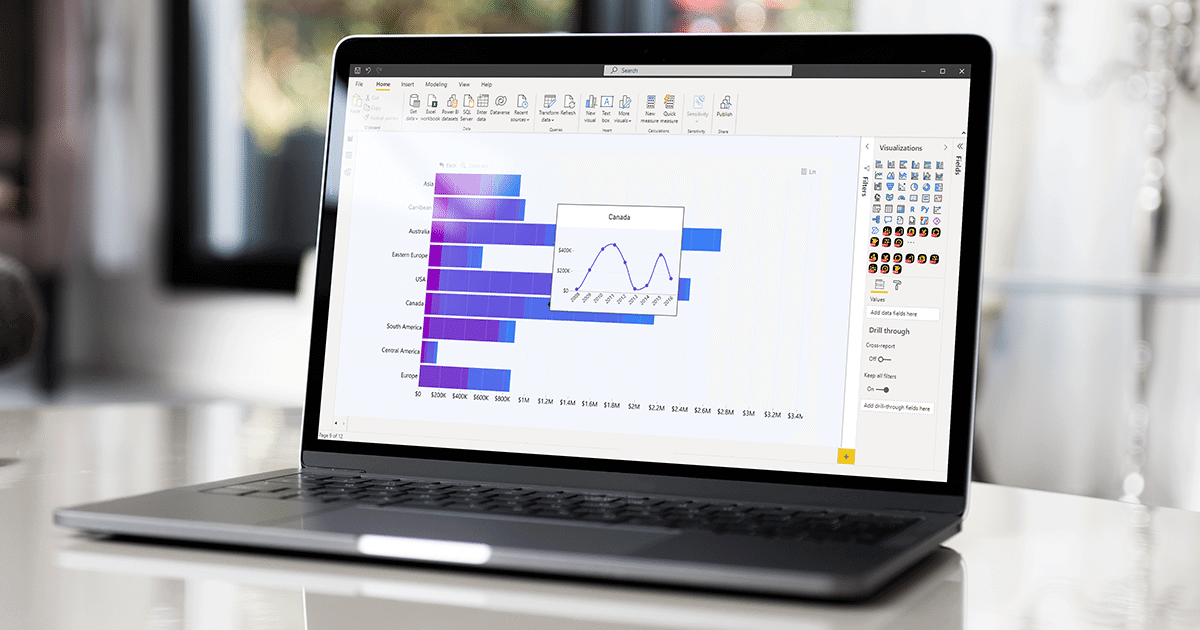
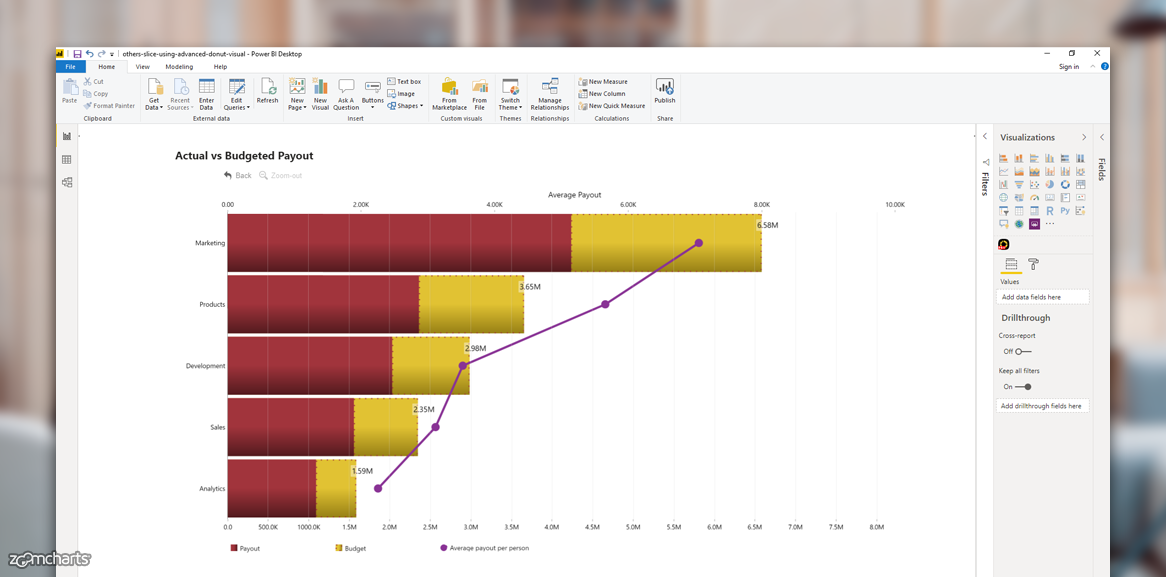
Build traditional bar visual or add fresh spin by combining bars, lines and areas
Drill Down Combo Bar PRO is a long-awaited addition to the ZoomCharts custom visuals suite. It stands out from the crowd of other bar visuals with ability to combine 3 chart types – bar, line and area. Because of this feature, you can not only build unique data visualizations, but also save valuable screen space.
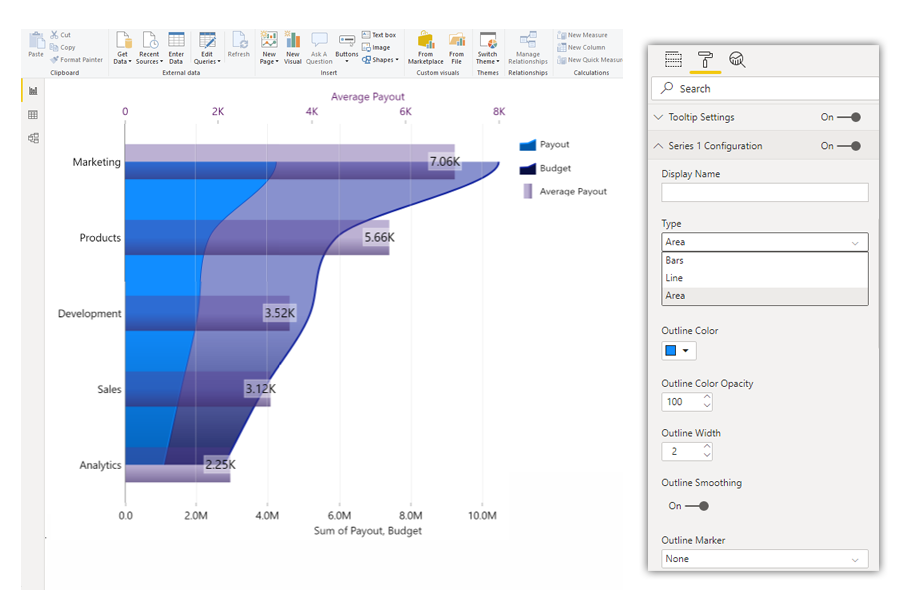
You will be able to set a different chart type for each series, as well as customize colors, fonts, outlines, markers, values, add thresholds and more.
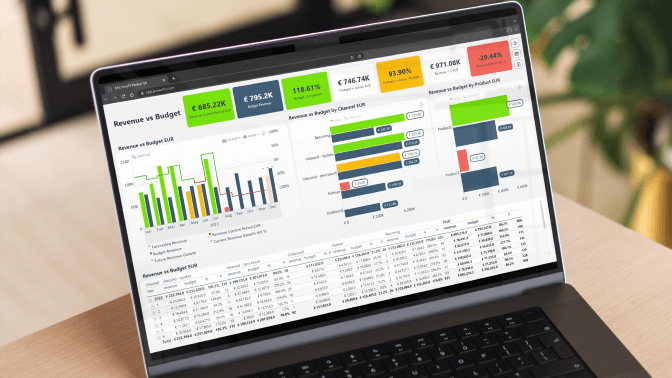
Rich stacking and clustering options
Another key feature of Drill Down Combo Bar is multiple stacking and clustering options. There is normal stacking, 100% proportional and zero based stacking available.
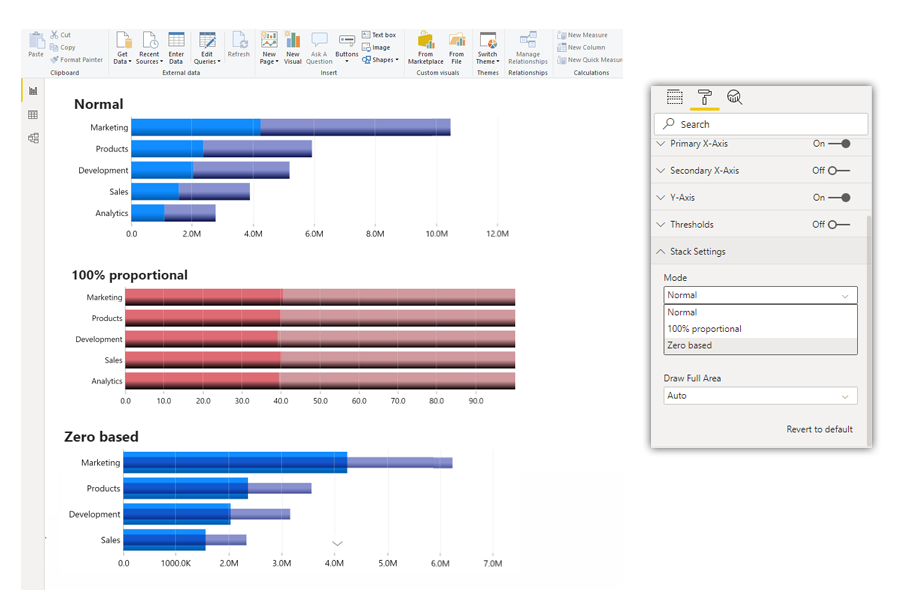
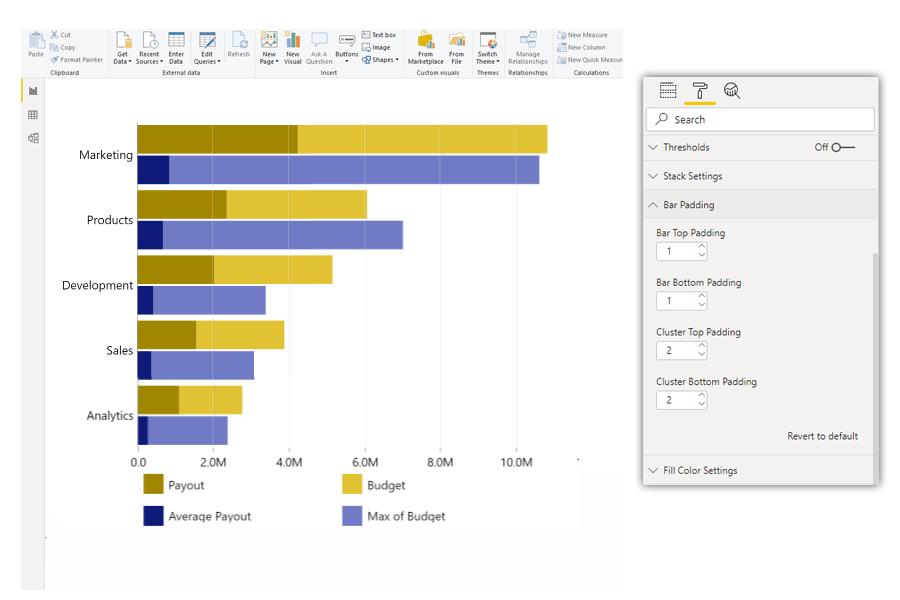
You can also group data in clusters and adjust cluster padding as necessary.
In addition, the bar visual offers:
- On-chart interactions –click, pan, zoom-in/out to explore multiple drill-down levels
- Static and dynamic thresholds – set up to 3 thresholds to demonstrate targets or benchmarks
- Full customization – customize X and Y axes, legends, stacks, tooltip, fill settings, outlines
- Touch-driven slicer - filter the report page by using the visual itself (no need for external slicers);
- Support for multi-touch devices– get equal experience on desktop and mobile
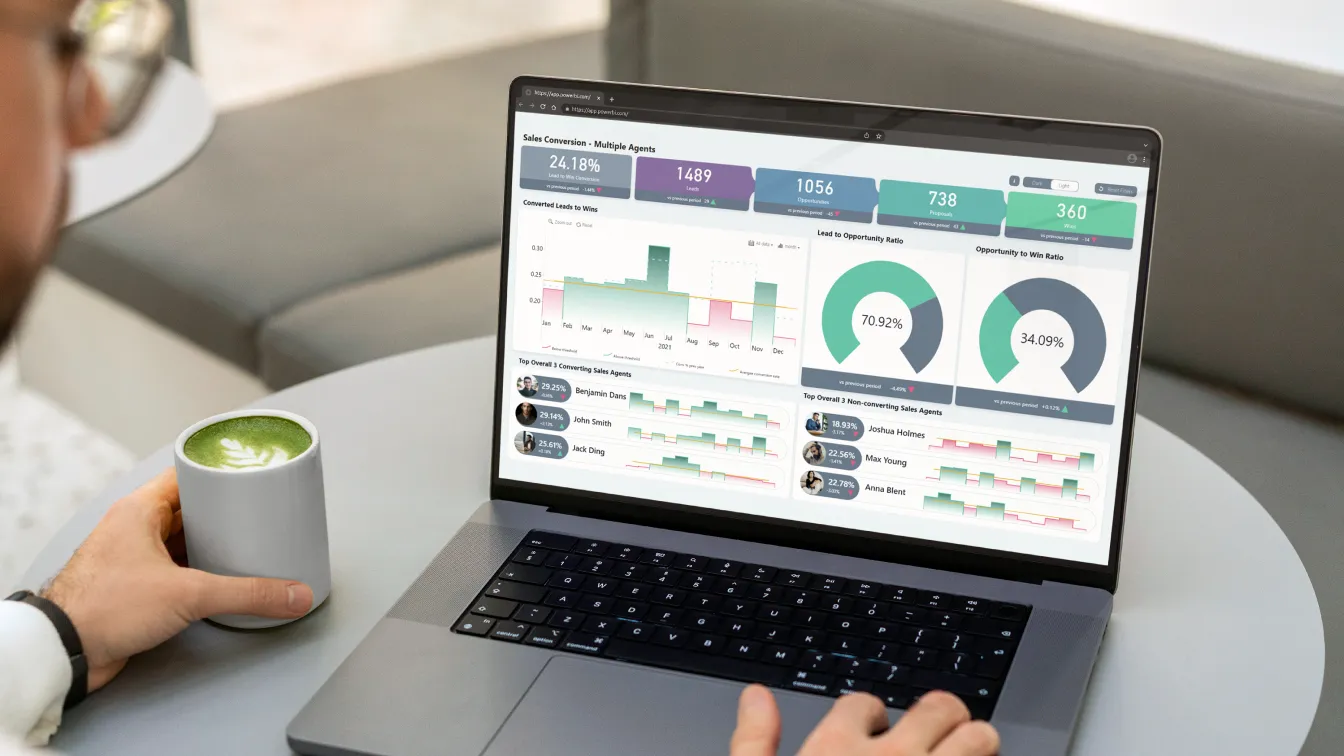
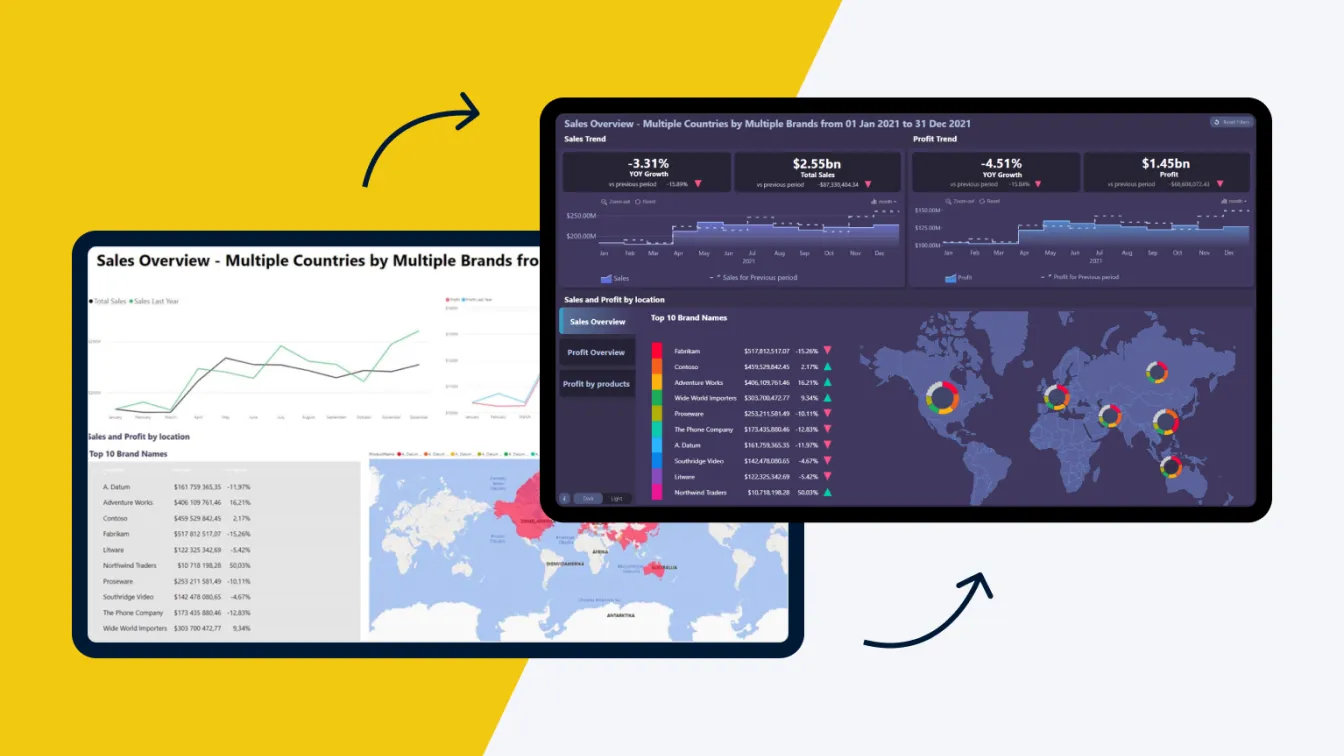
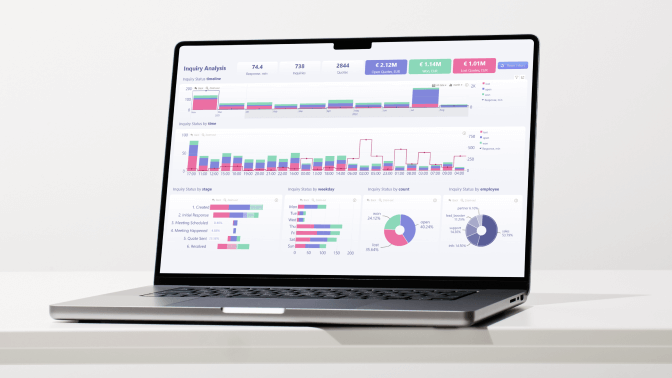
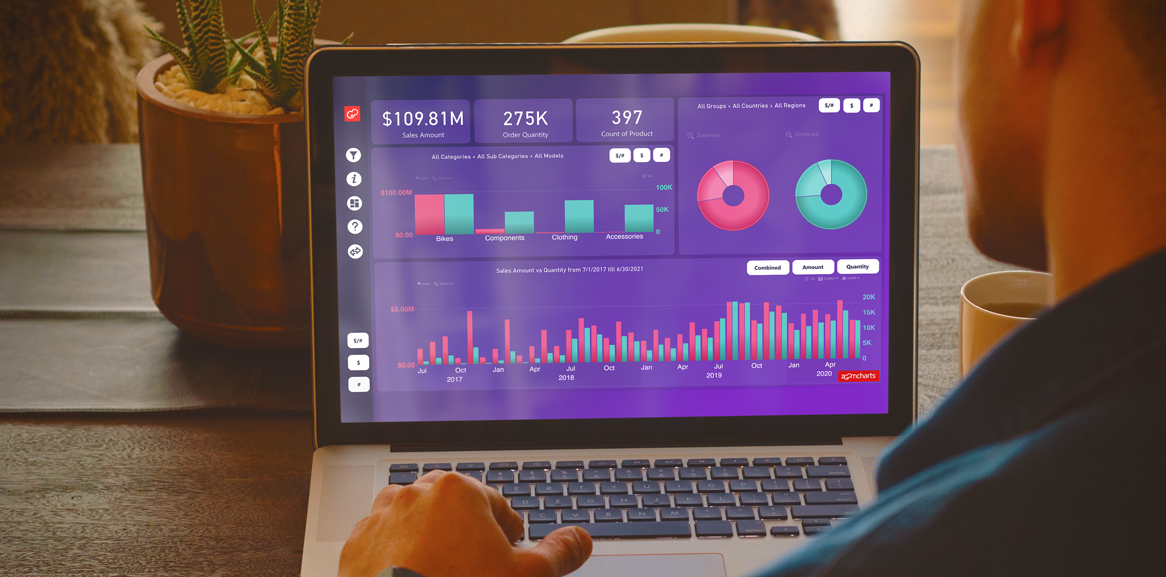
Best data exploration experience for report consumers
All ZoomCharts visuals focus on data exploration experience for report consumers. Drill Down Combo Bar PRO is not an exception. It has multiple intuitive on-chart interactions, that makes report exploration easy and fun.
Users can drill down to next data level by clicking directly on the chart, zoom in and out to inspect a specific section, single select and multiselect data categories, and use selection to filter the rest of report.
Bar visual will work best with categorical data for reports such as:
- Sales & Marketing –sales strategies, sales results and campaign-by-campaign marketing metrics
- Human Resources –hiring, sick days, overtimes and efficiency ratios by department or office
- Accounting and Finance –financial performance by region, office or business line
- Manufacturing –production efficiencies and quality metrics by product line
To access the new visual log in to your ZoomCharts account or start a trial. Visual is also available for download from Microsoft AppSource.


Want more info like this?
Subscribe to our newsletter and be the first to read our latest articles and expert data visualization tips!