Dec 16, 2021
How We Turned Many Excel Files Into an Interactive Power BI Report about Latvia’s Export landscape
How We Turned an Excel Sheet Into an Interactive Report: Latvia Export Barometer. ZoomCharts took part in a widescale project that created a full report of...
How We Turned an Excel Sheet Into an Interactive Report: Latvia Export Barometer. ZoomCharts took part in a widescale project that created a full report of...
How We Turned an Excel Sheet Into an Interactive Report: Latvia Export Barometer.
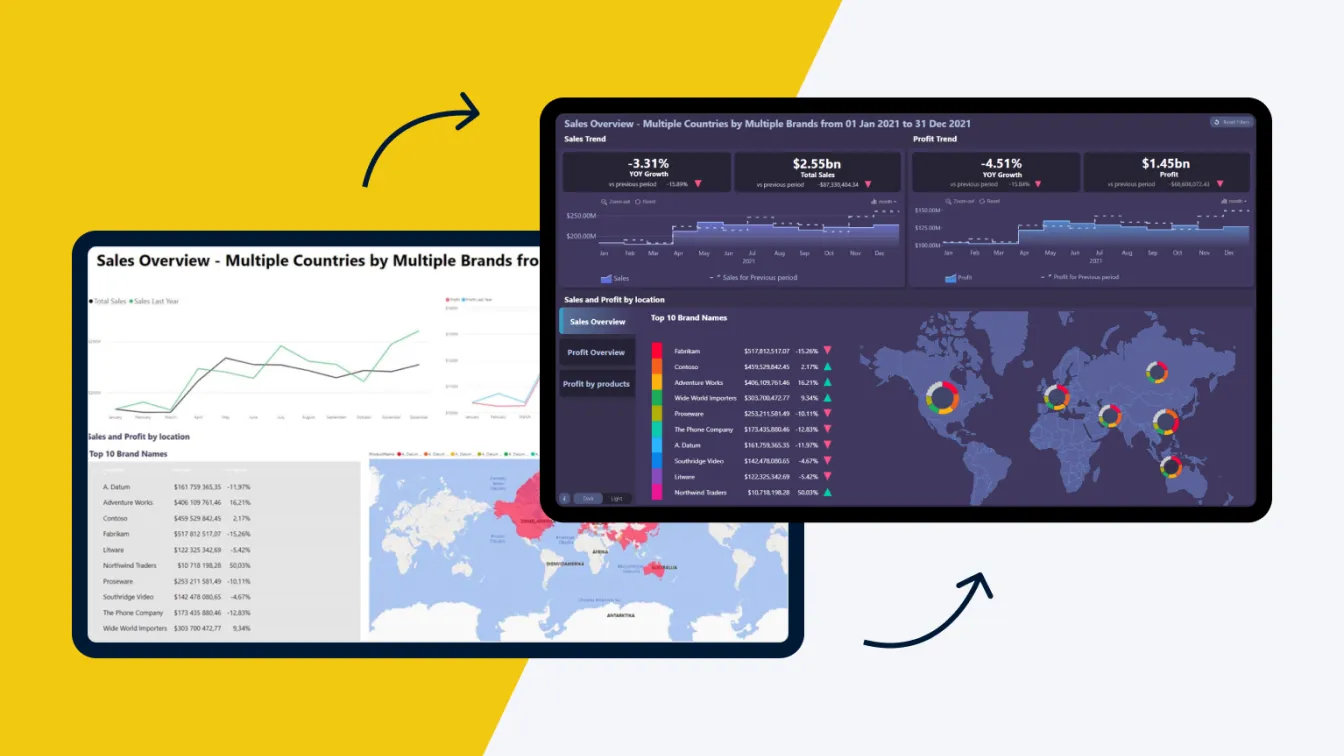
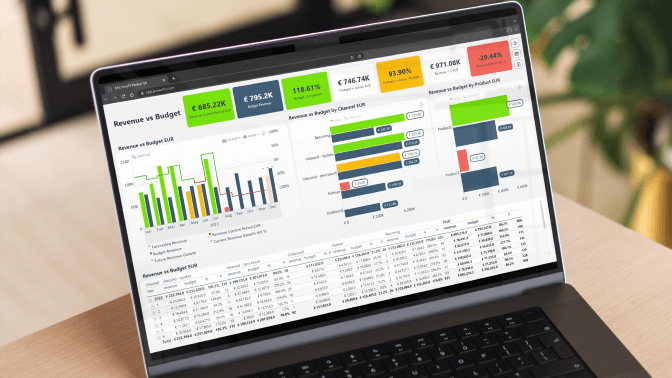
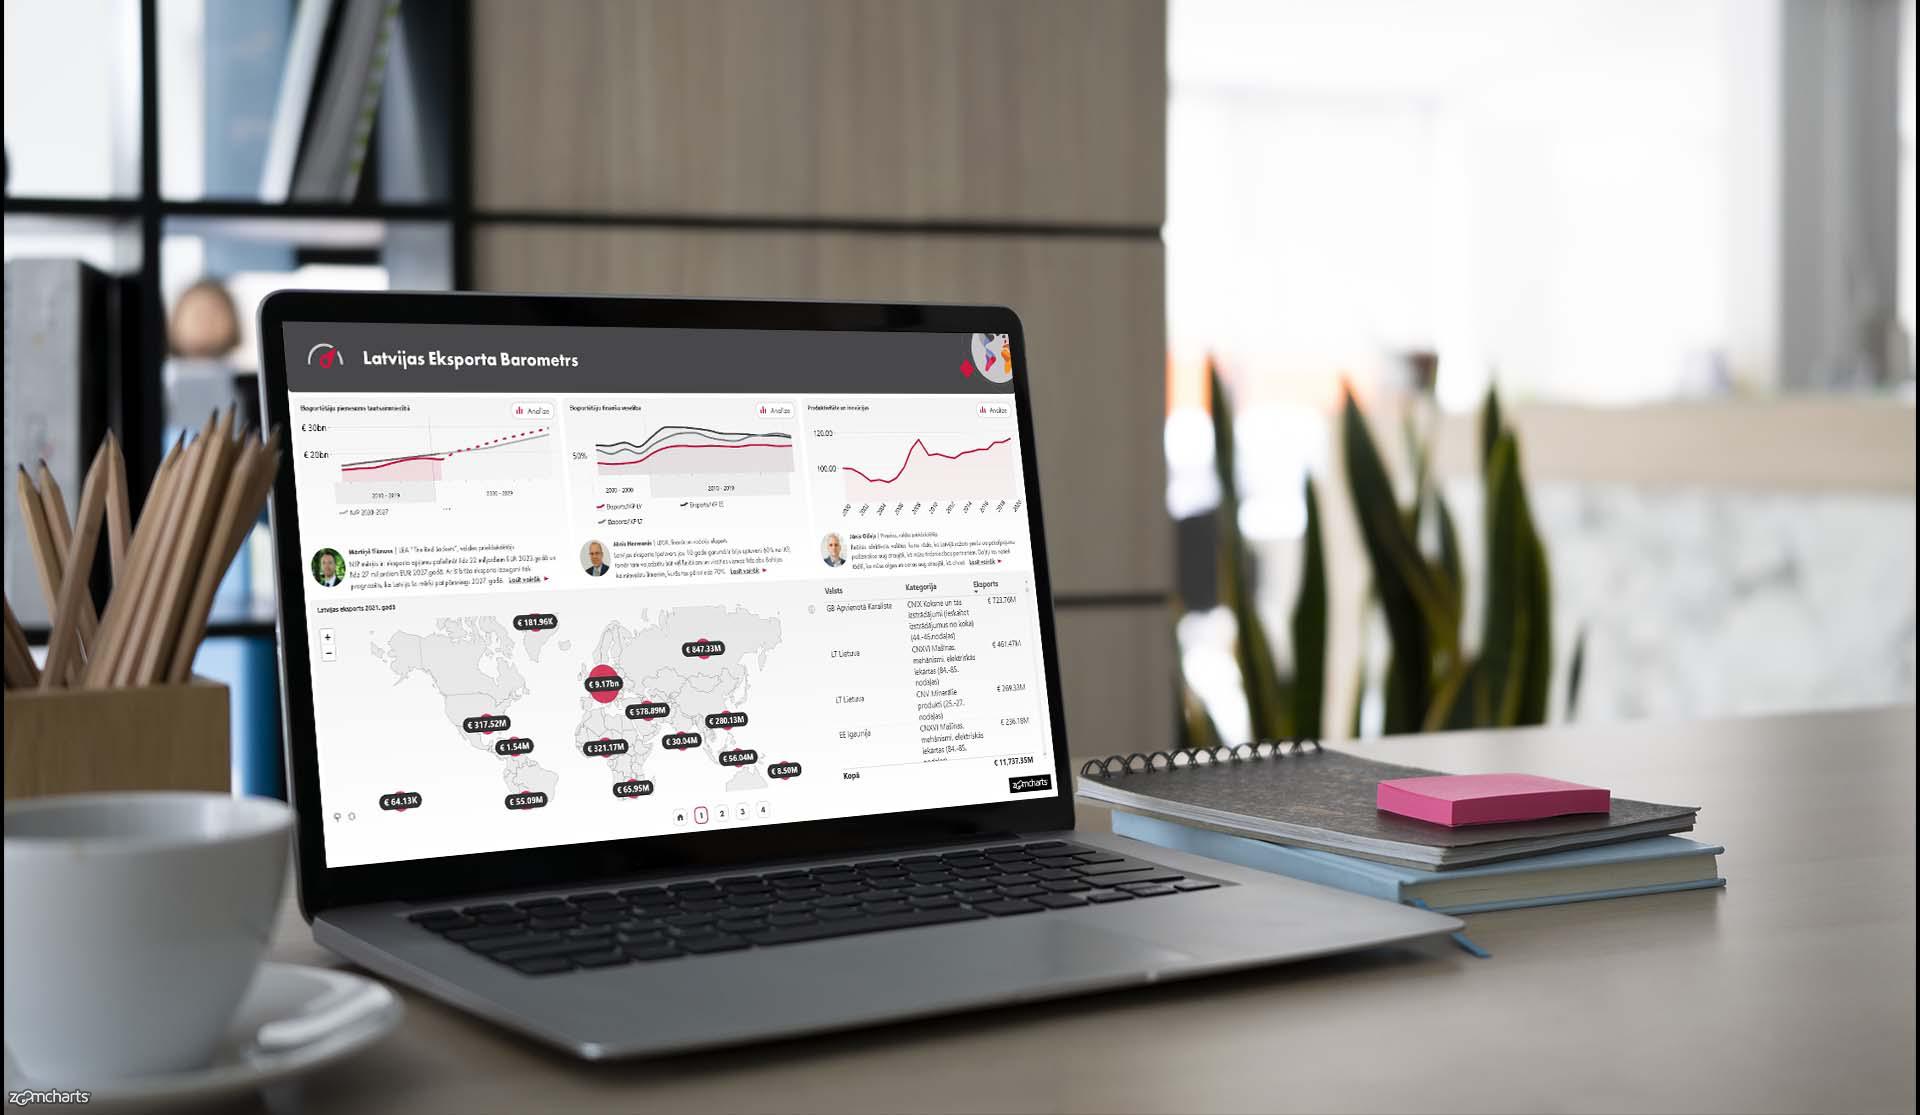
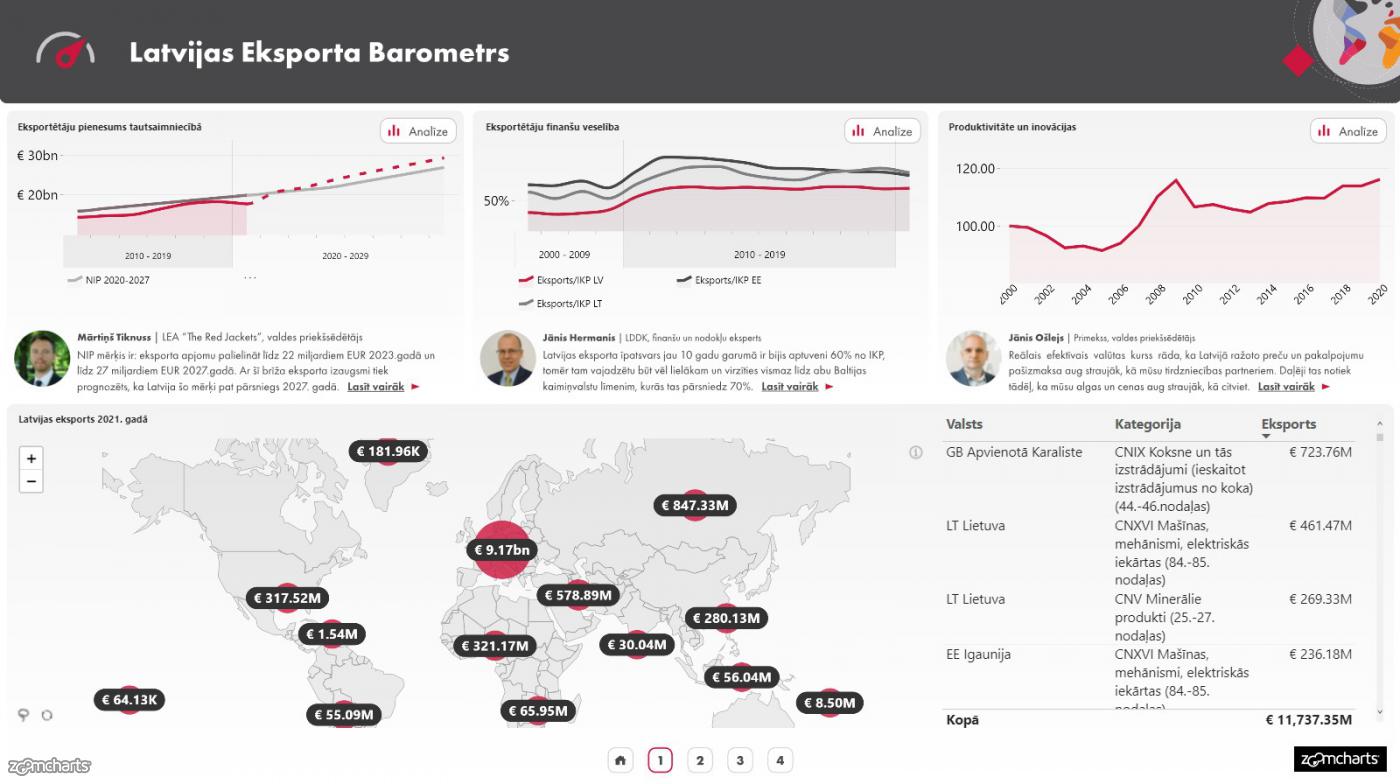
ZoomCharts took part in a widescale project that created a full report of Latvia’s Export Barometer. This report focused on Latvia’s export shifts within the past 3 years to more accurately assess Latvia’s overall export growth.
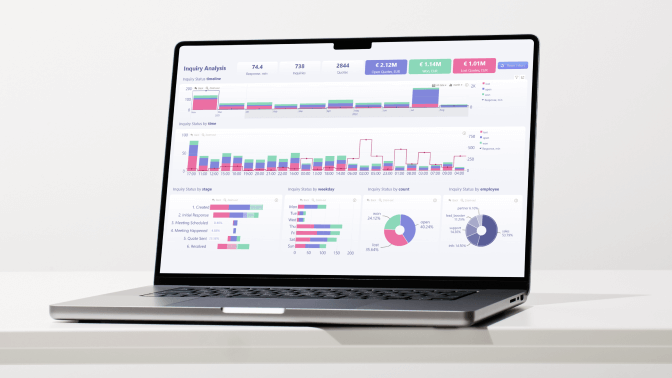
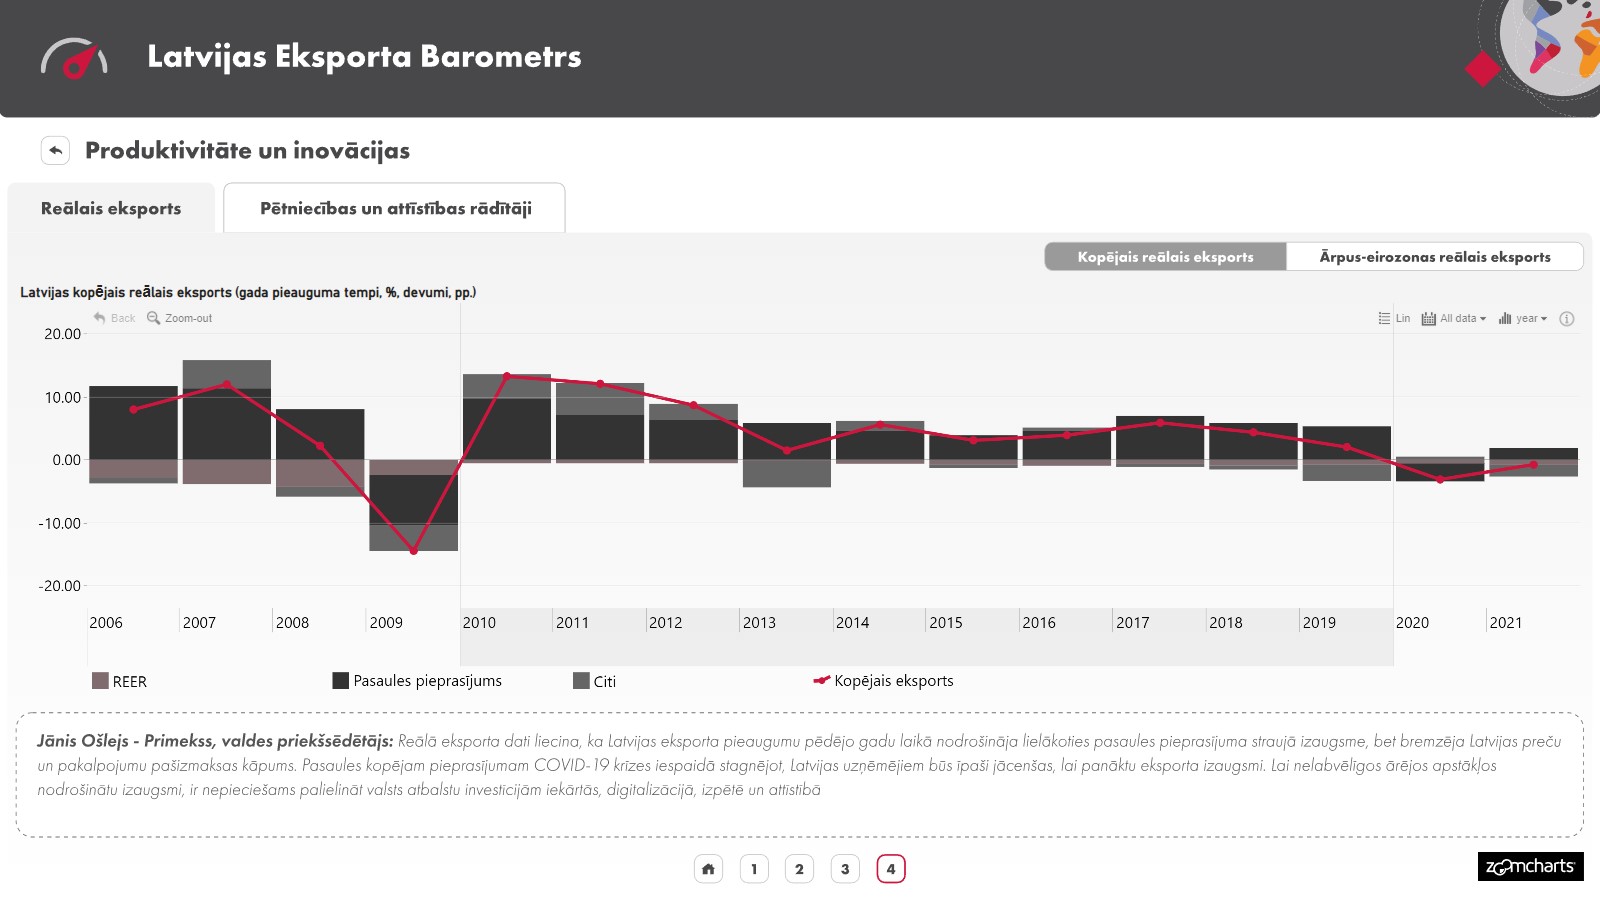
The Latvia Export Barometer is intended to showcase Latvia’s export landscape to a wider audience, including the government sector, companies, and the general public. The interactive nature of the report, made possible by ZoomCharts, allows everyone to gain full comprehension of Latvia’s exportation process. The Latvia Export Barometer was publicly demonstrated during the Export and Innovation Awards’ closing ceremony and is available for public viewing online.
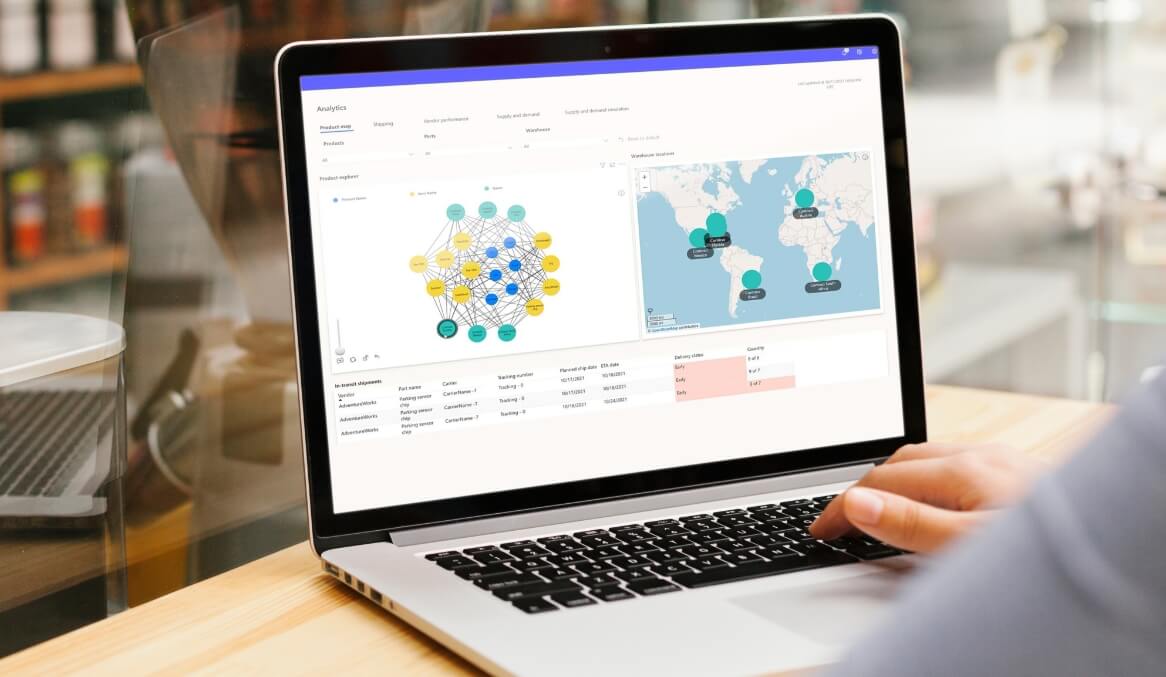
ZoomCharts received datasets from a variety of data and statistics suppliers and set out to clean up the data in preparation for importing it into Power BI. After discussing what story should the report tell and ensuring that it was not oversaturated with information while still being capable of engaging users, we input that data into Power BI.
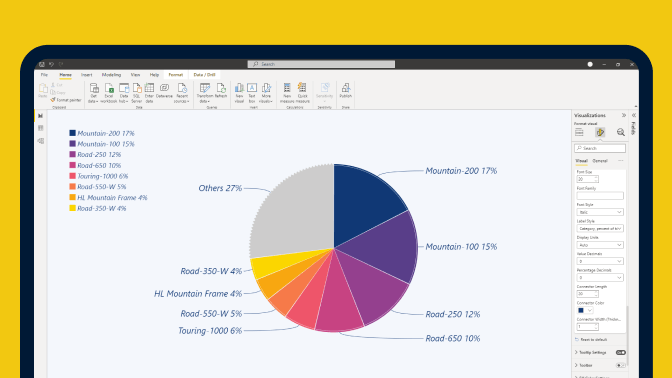
A report cannot be made more interactive than the data permits. If the data is one-dimensional and straightforward, there is no use in performing a drill-down to analyze the data deeper or look at it from different aspects.
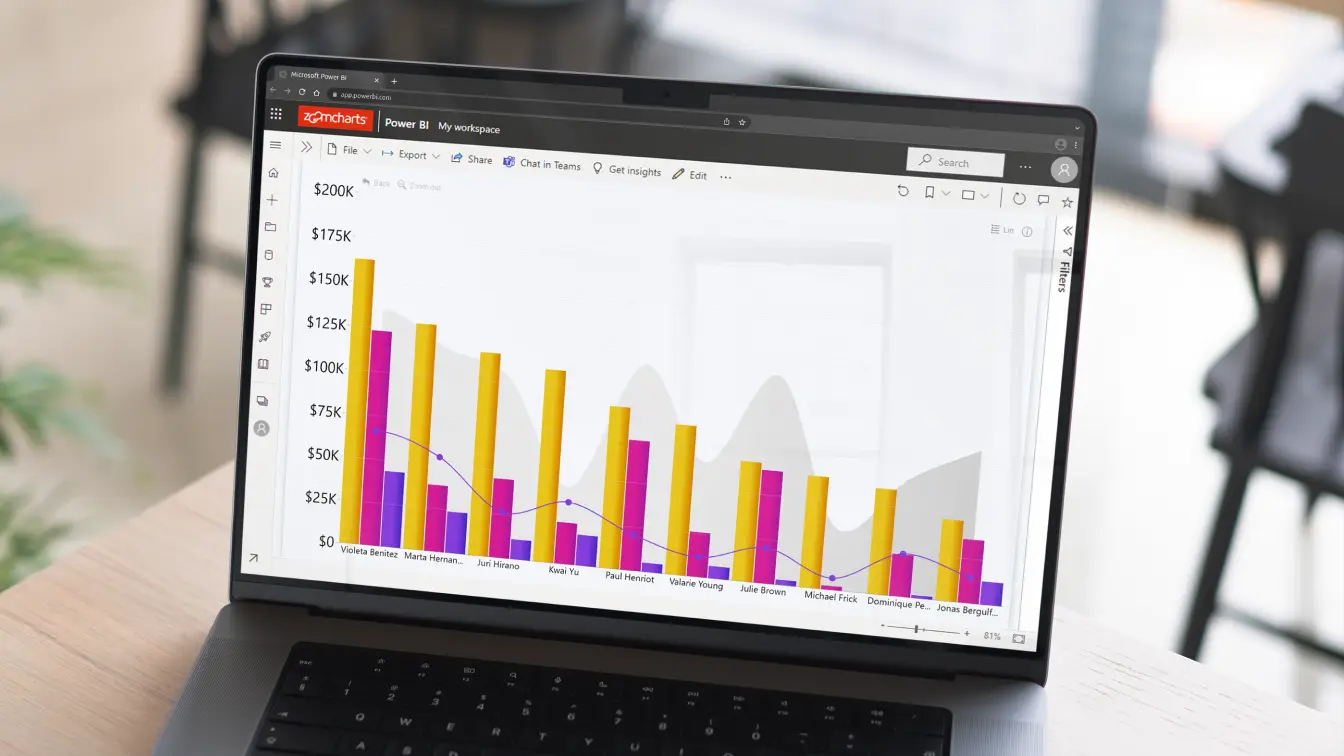
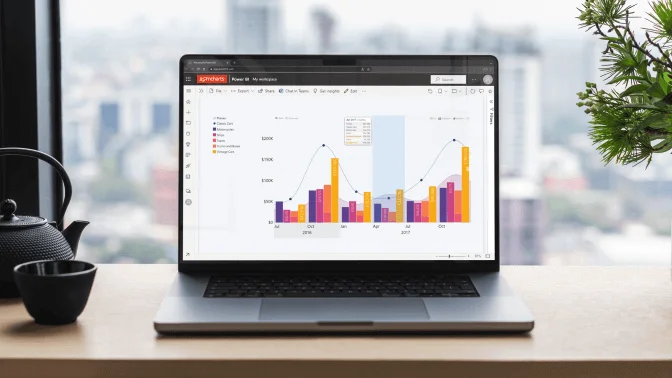
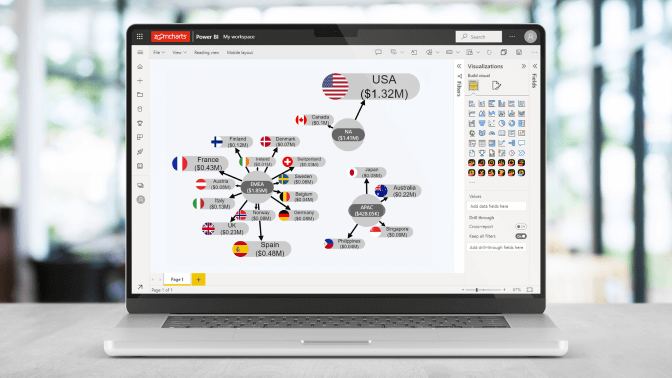
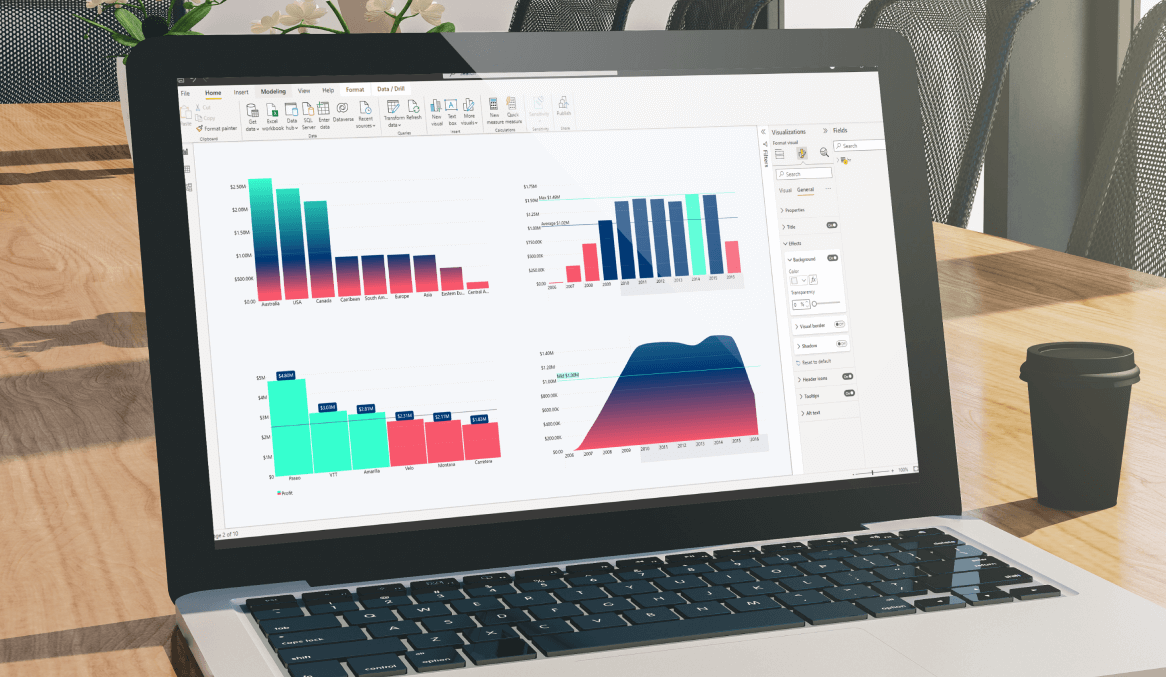
ZoomCharts custom visuals are known for their interactive approach to data visualization and analysis. We strive to provide stellar interactive charts through our custom visuals and report design services.
If you would like to have your business data turned into highly engaging and productive reports, ZoomCharts offers a report overhaul service, where we can help take the next step into the world of BI.
Get better reports
See full report here!

Want more info like this?
Subscribe to our newsletter and be the first to read our latest articles and expert data visualization tips!